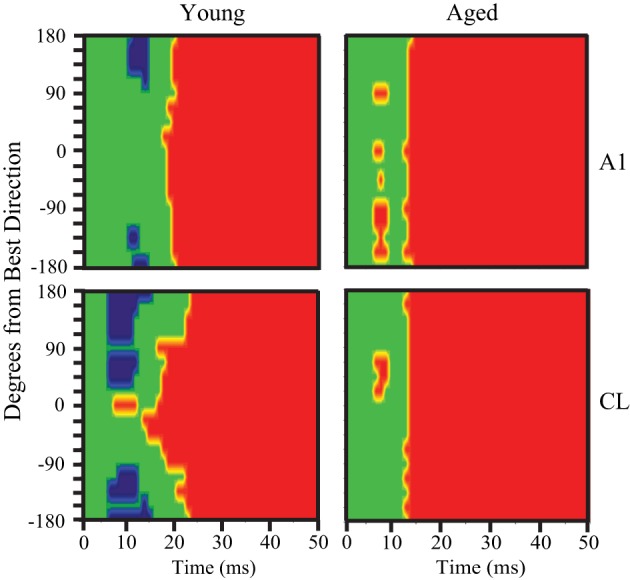
Figure 9.

Pre-onset inhibition in young but not aged monkeys. Each panel shows the bins that have significantly less (blue) or significantly more (red) activity compared to spontaneous. The population response of young animals is shown at the left, aged animals to the right, with A1 neurons in the top row and CL neurons in the bottom row. A1 of young animals shows pre-onset inhibition at the directions farthest from the best direction, but in CL this is true across a broader spatial extent (bottom left). In contrast, aged animals show no pre-onset inhibition at any direction.
