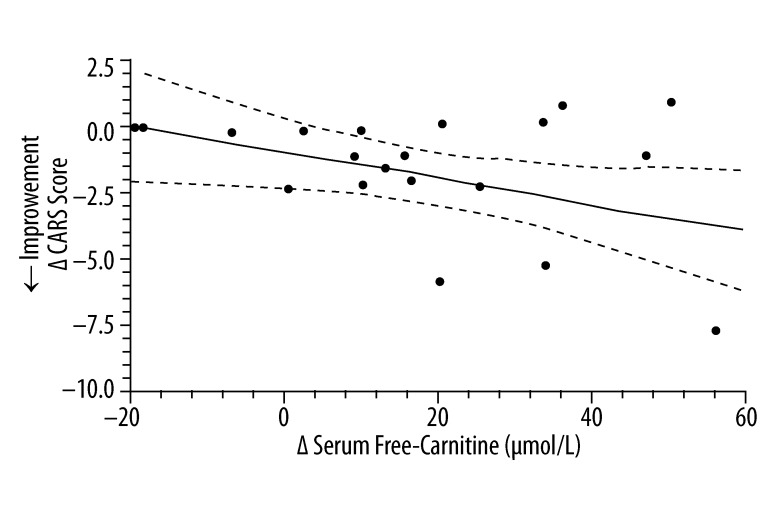
Figure 5.
The correlation* between the change in serum free-carnitine and the change in CARS score (n=20)**. * simple linear-regression statistic; ** L-carnitine group (n=12) and placebo group (n=8); ____ – linear regression estimate; - - - - – 95% confidence interval for linear regression estimate; Δ CARS Score =−0.047 Δ Serum Free Carnitine (μmol/L) − 0.81; R2=0.20, P=0.047.

