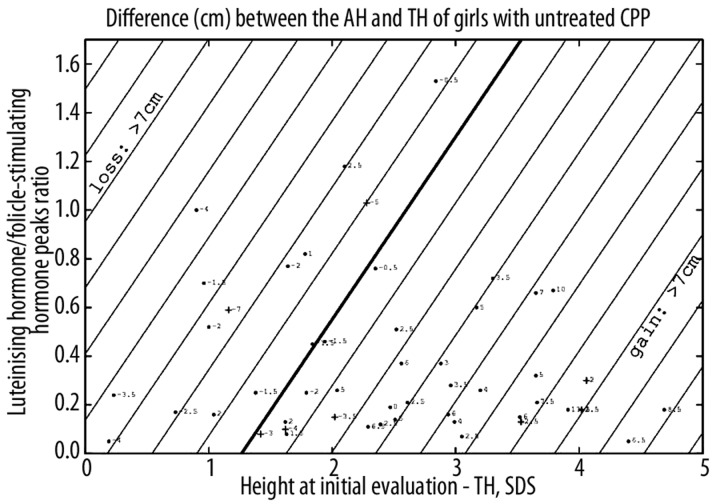
Figure 2.
Predictions of the difference (cm) between adult height (AH) and target height (TH) of girls with untreated CPP. Straight lines are contour plots, every cm. Each point corresponds to the predicted difference, with the actual difference indicated. The point is changed to a cross when the actual value is more than 3 cm lower than the calculated one. Two patients located in the upper part were deleted.

