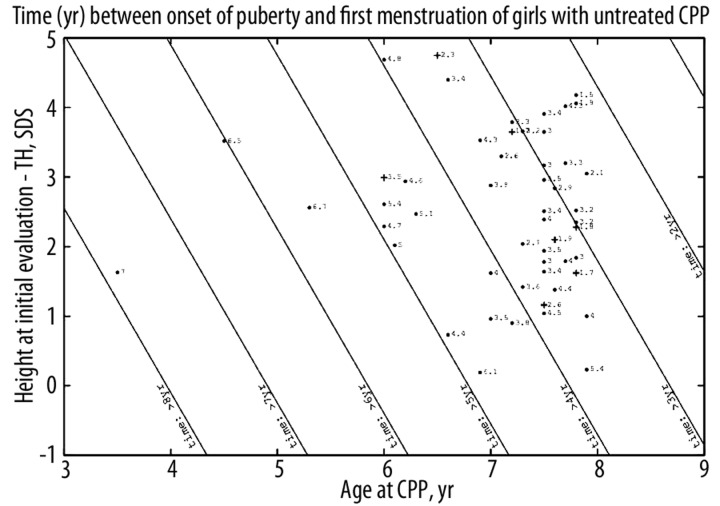
Figure 3.
Predictions of the time (yr) between the onset of puberty and the first menstruation of girls with untreated CPP. TH: target height. Straight lines are contour plots, every year. Each point corresponds to the predicted time, with the actual time indicated. The point is changed to a cross when the actual time is more than one year less than the calculated one.

