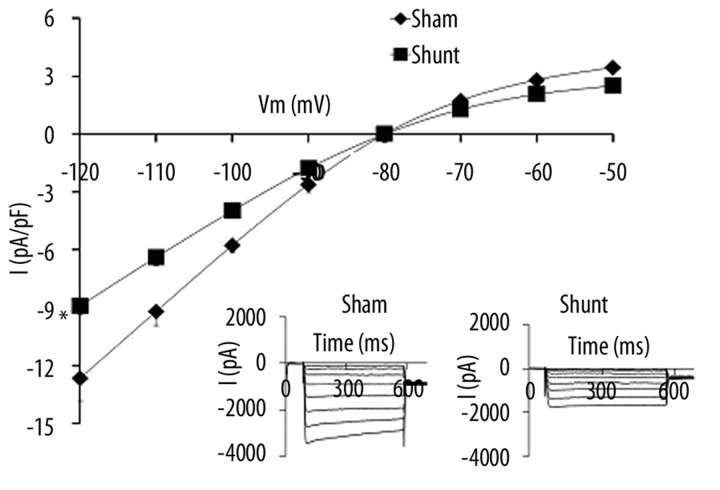
Figure 4.
IK1 voltage relationship for normal cardiomyocytes and volume-overload induced hypertrophied cardiomyocytes. The inset in each graph shows the respective representative current responses at and -120 mV for IK1. Data are presented as average current density ±SEM with n=5–10. * P<0.05 Sham vs. Shunt.

