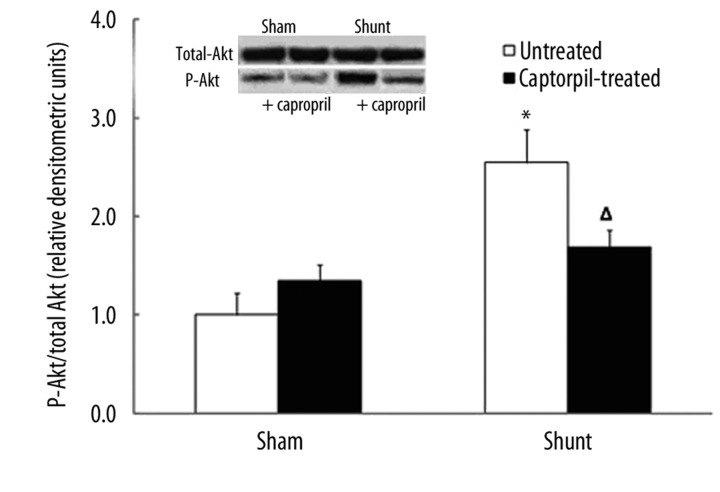
Figure 7.
Effects of IGF-1 (10−8 M) on the activation level of Akt in untreated (white bars) vs. captopril-treated (black bars) of sham and hypertrophied hearts. Data are expressed as the ratio of phosphorylated over total protein normalized to control untreated hearts. The inset shows representative western blot of total and phosphorylated Akt. The data are presented as average ±SEM with n=3 (from different heart samples). * P<0.05 Sham vs. Shunt; Δ P<0.05 Captopril-treated vs. Untreated.

