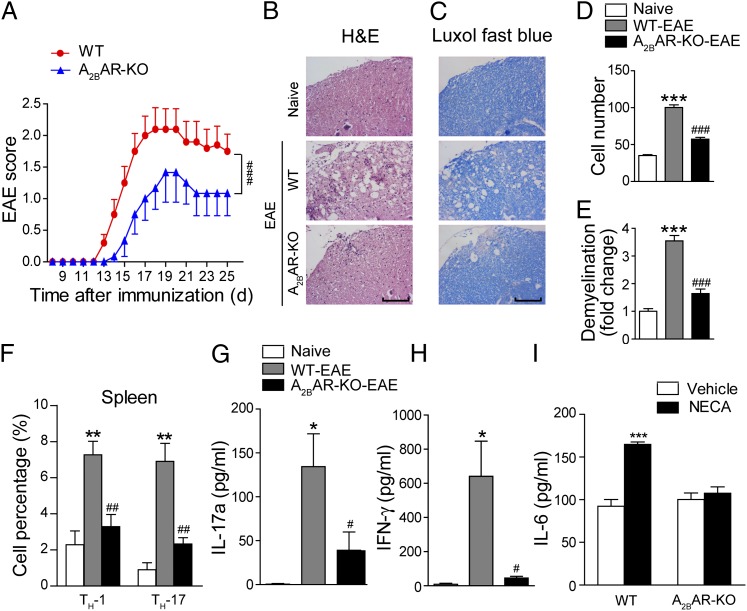
FIGURE 6.
A2BAR-KO suppresses EAE pathogenesis. (A) Clinical scores of EAE induced in WT and A2BAR-KO mice. Data are mean ± SEM (n = 10). ###p < 0.001 (two-way ANOVA test). (B) H&E staining and (C) Luxol fast blue staining of the paraffin sections of the spinal cords isolated from naive and EAE-induced WT or A2BAR-KO mice on day 17 PI. Scale bar, 100 μm. (D and E) Quantification of CNS infiltrates and the amount of demyelination presented in (B) and (C). Data are mean ± SEM. Three mice from each group were sacrificed, and 15 sections from each mouse were analyzed. ***p < 0.001 versus naive, ###p < 0.001 versus WT-EAE. (F) Th1 and Th17 cells were analyzed by intracellular staining of IFN-γ and IL-17a, respectively, in the CD4+ gate. Data are mean ± SEM (n = 6), **p < 0.01 versus naive, ##p < 0.01 versus WT-EAE. (G and H) Splenocytes from naive and EAE-induced WT or A2BAR-KO mice were restimulated in vitro with MOG35–55 for 48 h. IL-17a (G) and IFN-γ (H) in the supernatants were detected with ELISA. Data are mean ± SEM (n = 6), *p < 0.05 versus naive, #p < 0.05 versus WT-EAE. (I) CD11c+ DCs isolated from WT or A2BAR-KO mice were stimulated with anti-CD40 (10 μg/ml) for 36 h alone or in combination with NECA (10 μM), and IL-6 production was measured. Data represent mean ± SEM (n = 3), ***p < 0.001.

