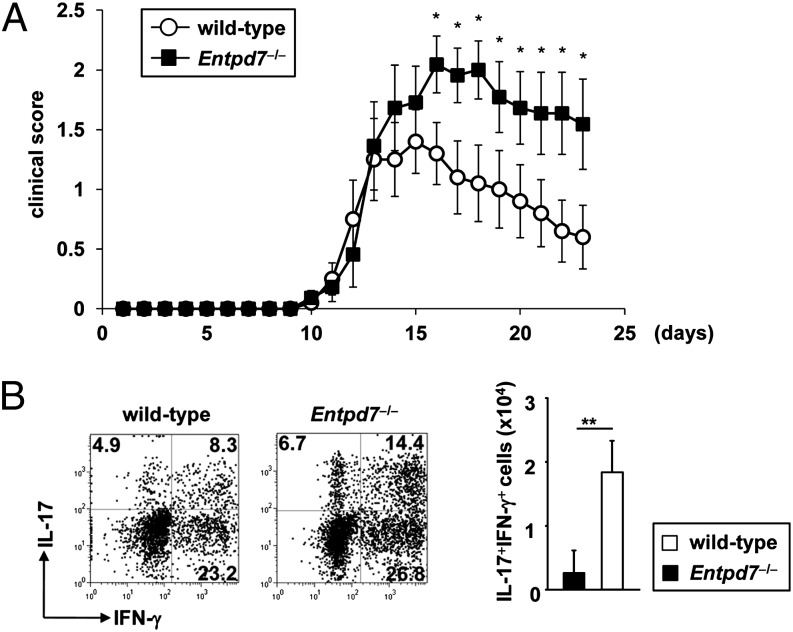
FIGURE 7.
Severe EAE in Entpd7−/− mice. (A) Wild-type (n = 10) and Entpd7−/− (n = 11) mice were immunized with 100 μg MOG35–55 peptide in CFA; 100 ng of pertussis toxin was injected i.p. on days 0 and 2. The mean clinical score was calculated by averaging the scores of the mice in each group. Data are mean ± SEM at each time point. Experiments were performed twice with similar results. *p < 0.05. (B) Representative FACS dot plots gated on CD4+ cells of the CNS in the indicated mice at day 17 after EAE induction (left and middle panels). CNS lymphocytes were isolated from wild-type and Entpd7−/− mice 17 d after EAE induction and analyzed for the production of IFN-γ and IL-17 from CD4+ T cells by flow cytometry (right panel). Data are representative of five mice analyzed. **p < 0.05.

