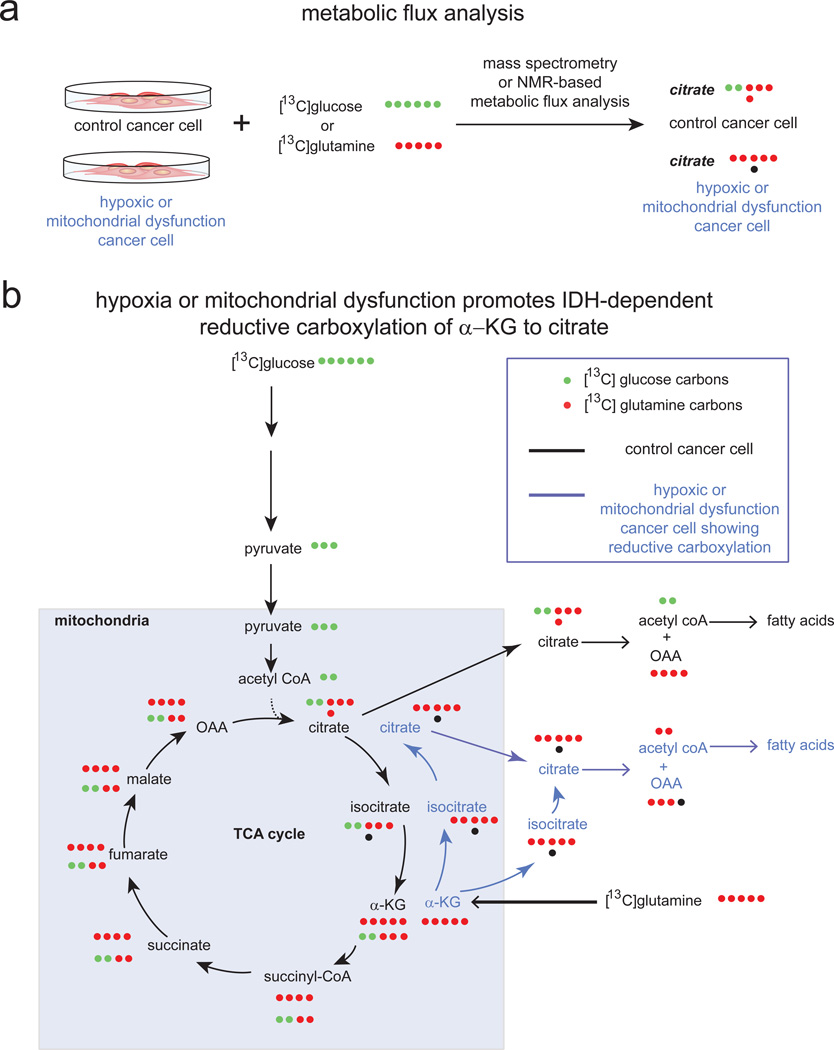
Figure 3. Metabolic Flux Analysis Reveals Dysregulated Cancer Cell Metabolism under Hypoxia or Mitochondrial Dysfunction.
a. Recent studies have performed metabolic flux analysis on cancer cells labeled with [13C]glucose or [13C]glutamine to dissect dysregulated metabolism of cancer cells exposed to hypoxia or mitochondrial dysfunction. b. These studies revealed that cancer cells under normoxia can form citrate through both glycolysis (bottom row of labeled carbons in TCA cycle) and glutaminolysis (top row of labeled carbons in TCA cycle). Upon hypoxia or mitochondrial dysfunction, cancer cells undergo a metabolic switch in citrate is produced through glutamine-dependent reductive carboxylation of α–ketoglutarate (α–KG) to form isocitrate via IDH1 or IDH2 and then to citrate to support de novo lipogenesis (blue arrows). Shown in the figure are [13C]-labeled carbons arising either from glucose (in green) or glutamine (in red) after one pass through the TCA cycle. Carbon atoms arising from CO2 are labeled as black dots.

