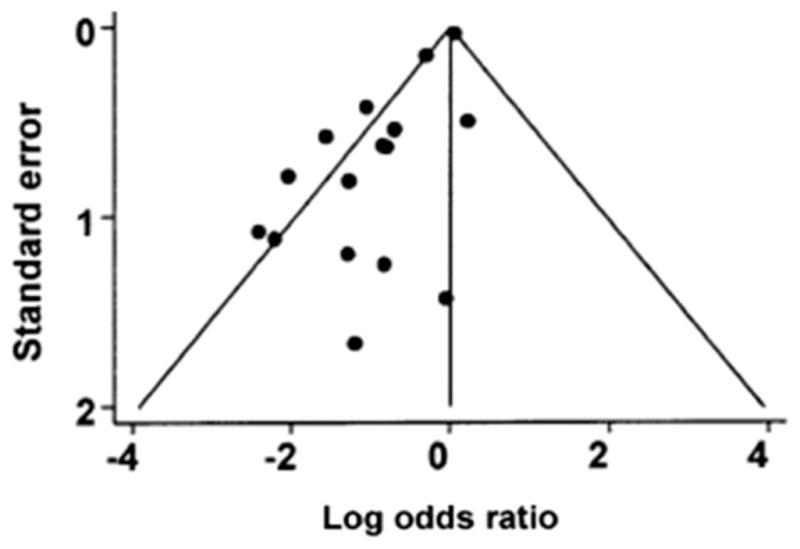
Figure.

Funnel plot for magnesium trials. Dots represent treatment effects from individual trials. The diagonal lines represent the expected 95% confidence intervals surrounding the pooled treatment effect. The absence of trials in the lower right corner of the figure suggests publication bias. Adapted from Sterne JA, Egger M. Funnel plots for detecting bias in meta-analysis: guidelines on choice of axis. J Clin Epidemiol. 2001;54: 1048. Figure 1 used with permission from Elsevier.
