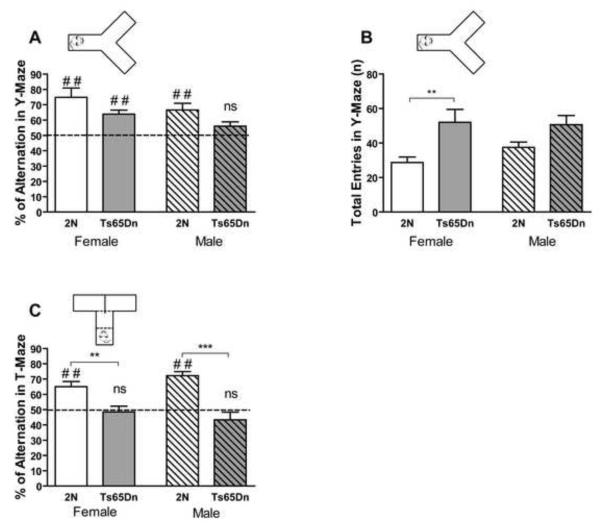
Fig. 5. Y-maze and T-maze spontaneous alternation in male and female Ts65Dn and 2N mice.
Alternation rates in Y-maze (A) and T-maze (C) and total number of entries to arms of Y-maze (B) are presented. Results are presented as Mean + SEM. In the Y-maze study, n=7 for female Ts65Dn mice and n=8 for male Ts65Dn, female 2N, and female Ts65Dn mice. In the T-maze test, n=10 for female 2N mice, n=9 for female Ts65Dn mice, n=6 for male 2N mice, and n=7 for male Ts65Dn mice. Alternation rate in Y-maze and T-maze (A and C) was compared with the chance level (50%), and the significant and nonsignificant differences are shown (ns=not significant, # #=p<0.01 compared to chance level). Alternation rate in Ts65Dn mice was significantly lower than 2N mice in both Y-maze and T-maze. Within group comparison between each pair of genotypes was analyzed, and only the significant differences are shown (*=p<0.05, **=p<0.01, and ***=p<0.001).

