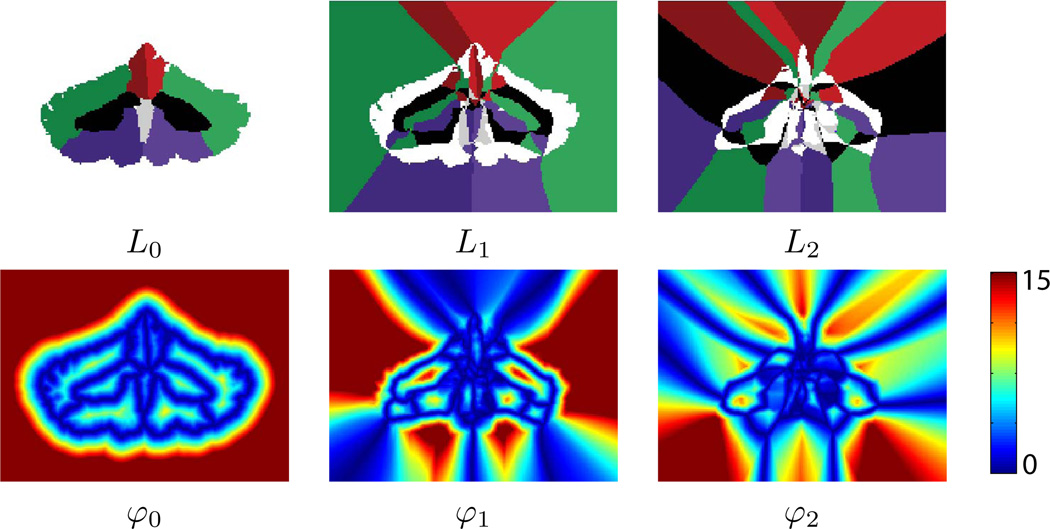
Figure 2.
Illustration of a three-level label-distance decomposition of a parcellated cerebellum: The color used for each object’s label is identical for L0, L1, and L2. The color scale for the distance functions have been compressed to the range [0, 15] to focus contrast around the boundaries. Here, blue pixels indicate points very close to a boundary, yellow pixels are more distant, and red are most distant.

