
Figure 2.
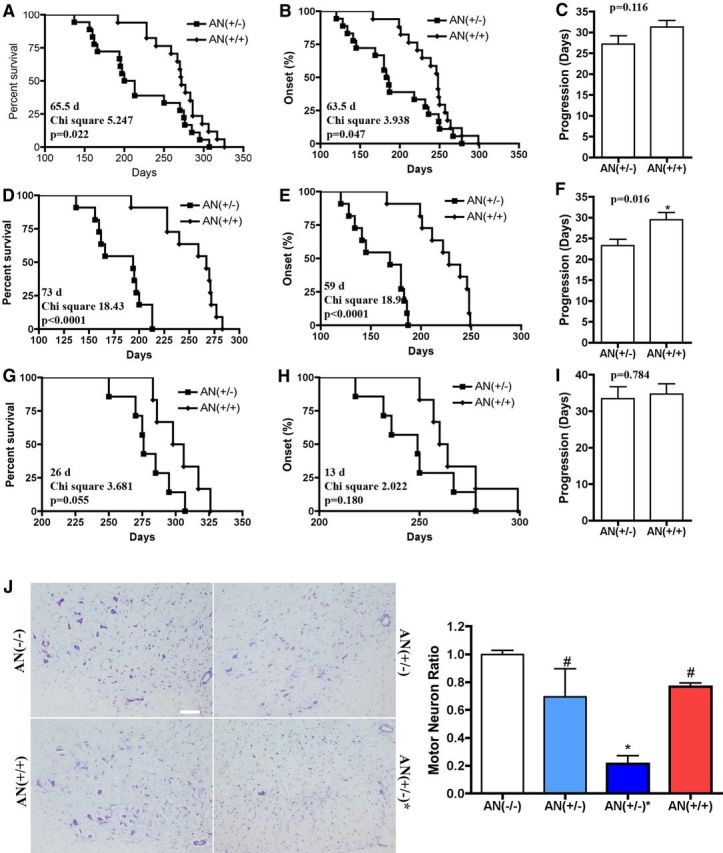
Overexpression of Nrf2 in astrocytes extends the life span of hSYNA53T transgenic mice and increases motor neuron survival in spinal cord. A, Nrf2 overexpression in astrocytes increased the median survival from 206.5 d in hSYNA53Tmice [AN(+/−)] (n = 18) to 272.0 d in hSYNA53T/GFAP-Nrf2 double transgenic mice [AN(+/+)] (n = 17). p = 0.0220, χ2 = 5.247. B, Nrf2 overexpression delayed disease onset from 184.5 d in AN(+/−) mice (n = 18) to 248.0 d in AN(+/+) mice (n = 17). p = 0.047, χ2 = 3.938. C, No difference was observed in disease progression between AN(+/−) mice (27.22 ± 1.93, n = 18) and AN(+/+) mice (31.29 ± 1.60, n = 17). Values are the mean ± SEM. D–F, Early onset (<200 d) cohort. D, The median survival of 194.0 d in AN(+/−) mice (n = 11) was prolonged to 267.0 d in AN(+/+) double transgenic mice (n = 11). p < 0.0001, χ2 = 18.43. E, The disease onset of 169.0 d in AN(+/−) mice (n = 11) was delayed to 228.0 d in AN(+/+) double transgenic mice (n = 11). p < 0.0001, χ2 = 18.92. F, The disease progression of 23.27 ± 1.53 d in AN(+/−) mice (n = 11) was significantly extended to 29.45 ± 1.77 d in AN(+/+) double transgenic mice (n = 11). p = 0.016. Values are the mean ± SEM. G–I, Late onset (>200 d) cohort. G, The median survival of 276.0 d in AN(+/−) mice (n = 7) was prolonged to 302.0 d in AN(+/+) double transgenic mice (n = 6). p = 0.055, χ2 = 3.681. H, The disease onset of 249.0 d in AN(+/−) mice (n = 7) was delayed to 262.0 d in AN(+/+) double transgenic mice (n = 6). p = 0.180, χ2 = 2.022. I, The disease progression in AN(+/−) mice (33.43 ± 3.25 d, n = 7) and AN(+/+) double transgenic mice (34.67 ± 2.86 d, n = 6) was similar; p = 0.784. Values are the mean ± SEM. J, Estimated number of motor neuron in the ventral horn of spinal cord of 6-month-old hSYNA53T transgenic mice without symptoms [AN(+/−)] and with symptoms [AN(+/−)*] along with age-matched littermate wild-type controls [AN(−/−)]. Left, Representative images with Nissl staining. Scale bar, 100 μm. The quantified data are shown on the right. Mean ± SEM; n = 3. *p < 0.01, AN(+/−)* versus AN(−/−); #p < 0.05, AN(+/+), AN(+/−) versus AN(+/−)*.