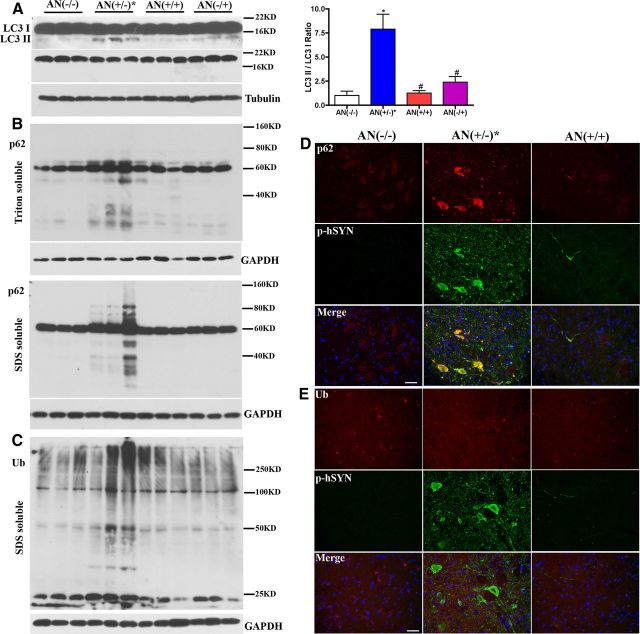
Figure 8.
Macroautophagy is dysfunctional in hSYNA53T mice, not in hSYNA53T/GFAP-Nrf2 double transgenic mice. A, Western blots for LC3. Top is overexposed to visualize LC3 II. A shorter exposure to quantify LC3 I is next. The quantification of LC3 II/LC3 I ratio is shown on the left. Mean ± SEM; n = 3. *p < 0.01, AN(+/−)* versus AN(−/−); #p < 0.01, AN(+/+), AN(−/+) versus AN(+/−)*. B, Western blotting of p62. Top, Triton-soluble fractions; bottom, Triton-insoluble fractions; n = 3. C, Western blotting of ubiquitin in Triton-insoluble fractions. Ub, ubiquitin; n = 3. Representative images for p-hSYNA53T and p62 (D) or Ub (E) colocalization; n = 3. Scale bars: 50 μm.

