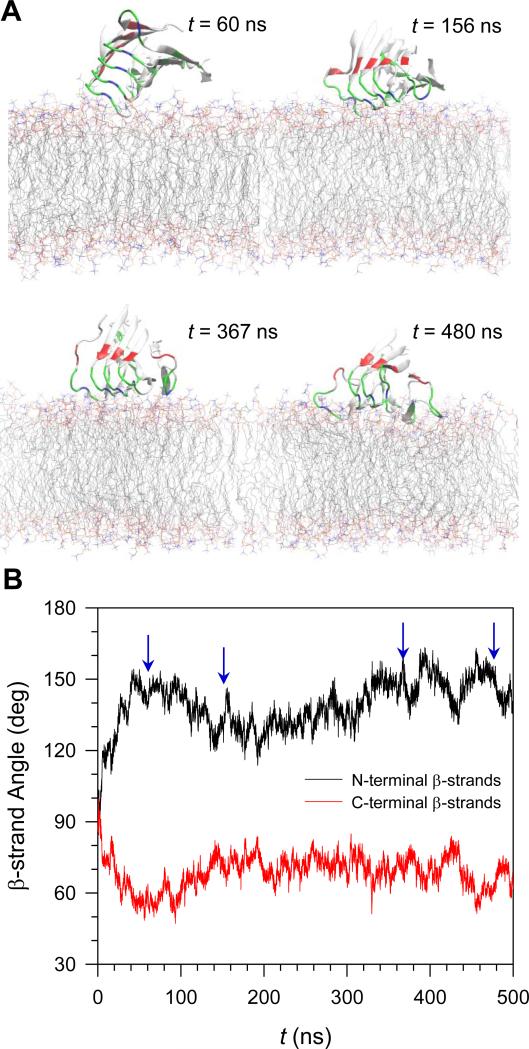
FIGURE 6.
(A) Snapshots of p3 (Aβ17-42) pentamer in configuration 1 at selected times, t = 60, 156, 367, and 480 ns, representing the various orientations on the DOPC bilayer. (B) Time series of β-strand angle with respect to the membrane normal for the N-terminal (black line) and C-terminal (red line) β-strands separately for the pentamer in configuration 1.

