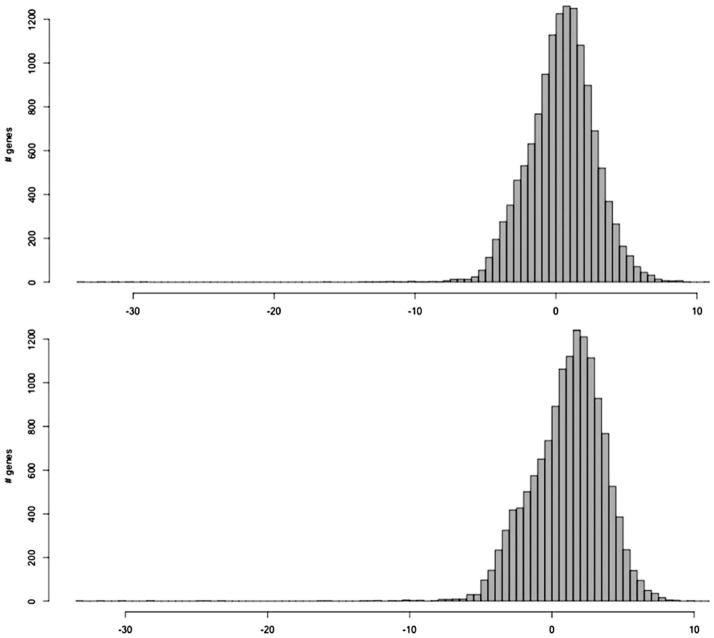
Figure 2.
The distribution of expression levels (log2 fragments per kilobase of exon per million mapped fragments [FPKM]) of genes detected in Broca area of Brain 70 (the upper diagram) and the same area in Brain 40 (the lower diagram). Genes with FPKM of 0 are excluded. This plot shows that there are few genes that have an FPKM between 0 and 0.001; the latter corresponds to approximately −10 on the logarithmic scale. The threshold of 0.001 was used as a minimum FPKM for determining expressed genes.

