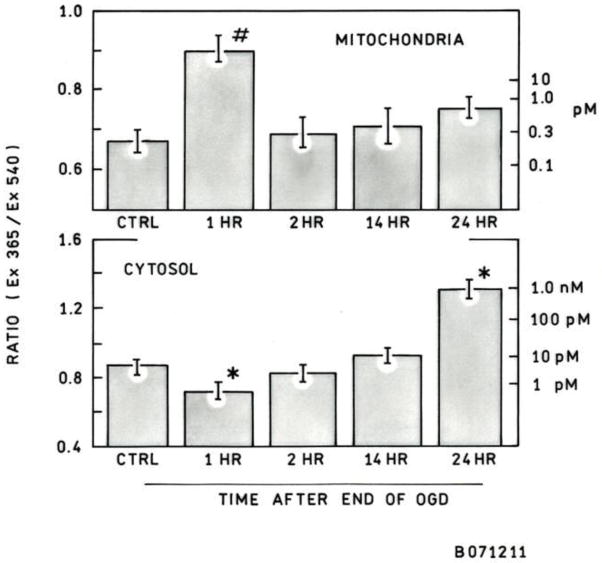
Figure 5.
Cytosolic and mitochondrial matrix free zinc concentrations following OGD. The average ratio of Ex365nm/Ex540nm was calculated for each cell (left scale), and from this ratio the zinc concentration could be determined using the calibration curve (right scale). After OGD there is a decrease in cytosolic zinc followed by a gradual increase. Mitochondrial matrix zinc increases significantly 1 hr after OGD and then returns to near physiological levels. The increase in matrix zinc occurs at the same time as the decrease in cytosolic zinc is observed. Error bars represent the standard error of the mean. ncytosol = 70–90 cells, nmito = 35–45 cells, * p < 0.05, # p < 0.01.

