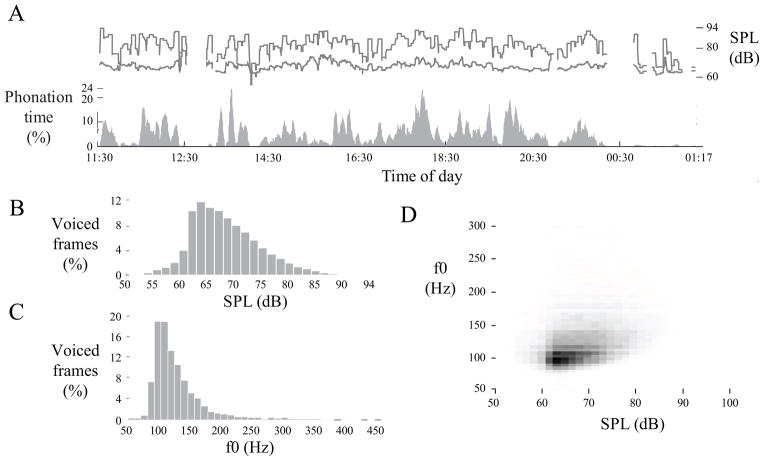
Fig. 5.
Voice use profile of subject N2’s first day (24-hour time format). (A) Five-minute moving average of phonation time (gray), average sound pressure level (SPL; lower line), and maximum SPL (upper line) for voiced frames; (B) histogram of fundamental frequency (f0); (C) histogram of SPL; and (D) phonation density showing the relative occurrence of particular combinations of SPL (horizontal axis) and f0 (vertical axis).

