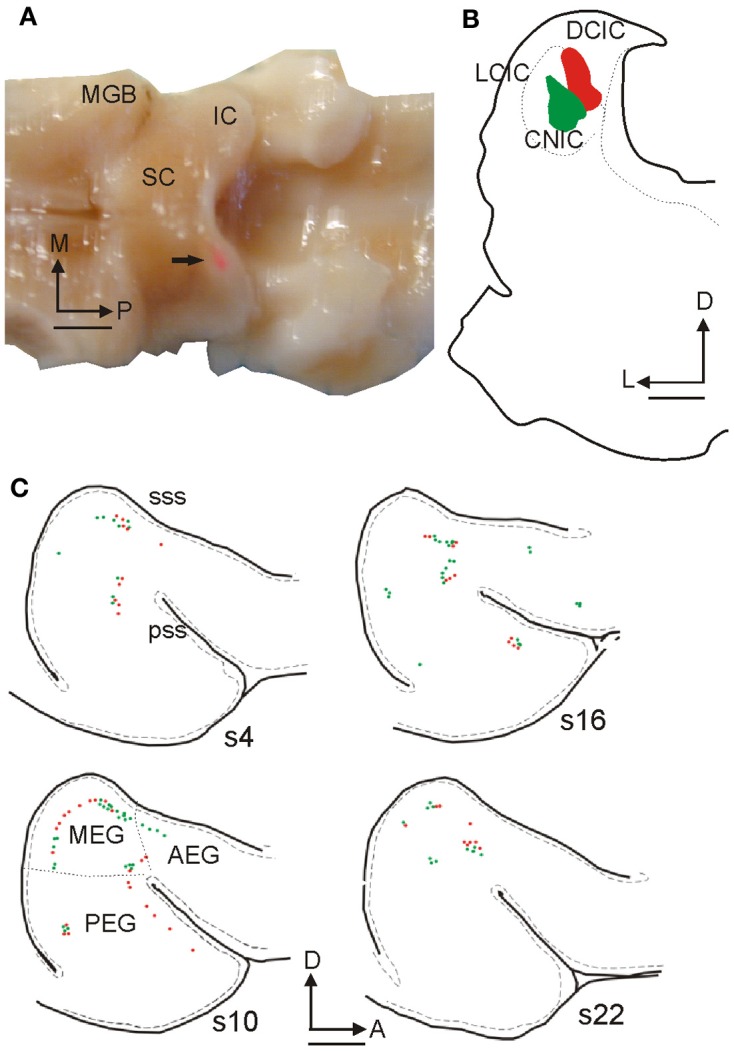
Figure 3.

Retrogradely labeled cells in ferret auditory cortex after fluorescent microbead injections in the IC. (A) Dorsal view of the ferret brain where both the cerebral cortices and the cerebellum were removed to visualize the thalamus and midbrain. A rhodamine microbead injection site can be seen in the left IC (arrow). (B) Coronal section at the level of the IC from this animal illustrating rhodamine and fluorescein microbead injection sites. (C) Drawings of tangential 50 μm sections spaced 300 μm apart from lateral to medial (s22 is the most medial) at the level of the left ectosylvian gyrus where the auditory cortex is located, showing green and red retrogradely labeled cells. Calibration bars: 2 mm (A,C) and 1 mm (B). Based on Bajo et al. (2007).
