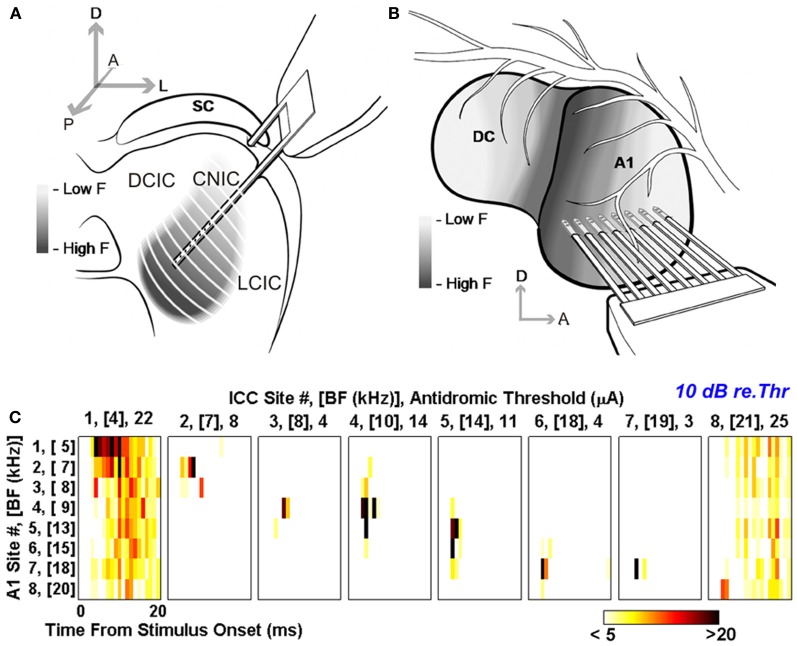
Figure 6.
Antidromic activation reveals tonotopically organized projections from A1 to the CNIC in guinea pig. Multi-site probes were positioned along the tonotopic axis of the guinea pig CNIC (A) and A1 (B). (C) Post-stimulus time histograms (PSTHs) for eight A1 locations with different best frequencies (BF) from low (location 1) to high (location 8). These responses were evoked by antidromic stimulation equivalent to 10 dB above threshold at eight frequency-matched locations in the IC. Color scale corresponds to the total number of spikes across 40 trials where any values ≤5 and ≥20 were set to white and black, respectively. Modified with permission from Lim and Anderson (2007).

