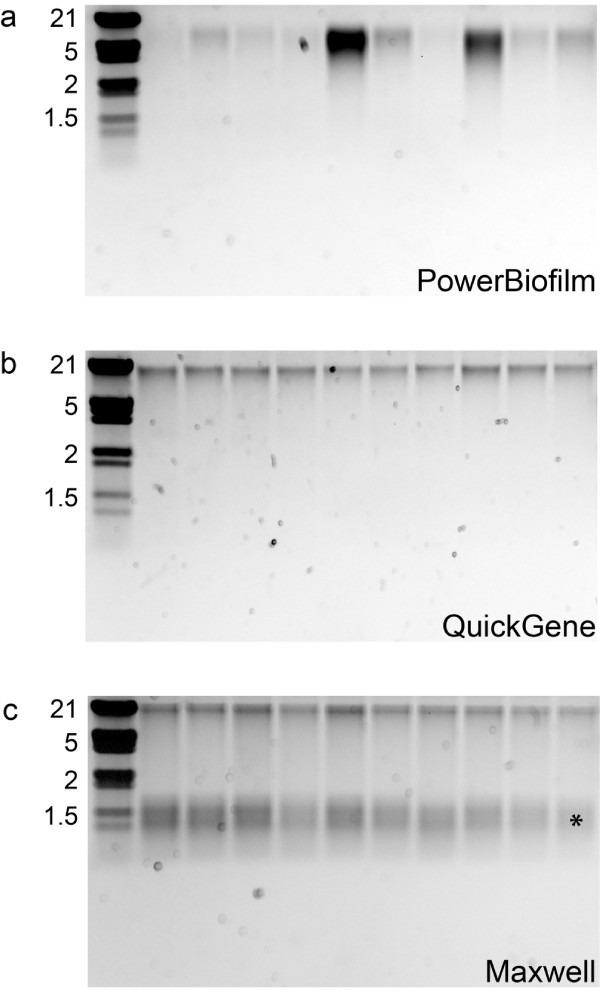
Figure 1.
Agarose gel analysis of sample A DNA extracts. Comparison of DNA fragment size and relative quantity among subsamples. An aliquot (10 μl) of DNA extracted from replicate subsamples of sample A using the a) PowerBiofilm, b) QuickGene and c) Maxwell methods. Low weight nucleic acid (RNA) species in Maxwell extractions are indicated by an asterisk. Sizes (kb) of bands in the Lambda DNA/EcoRI+HindIII marker (left lane) are indicated.

