
Figure 2.
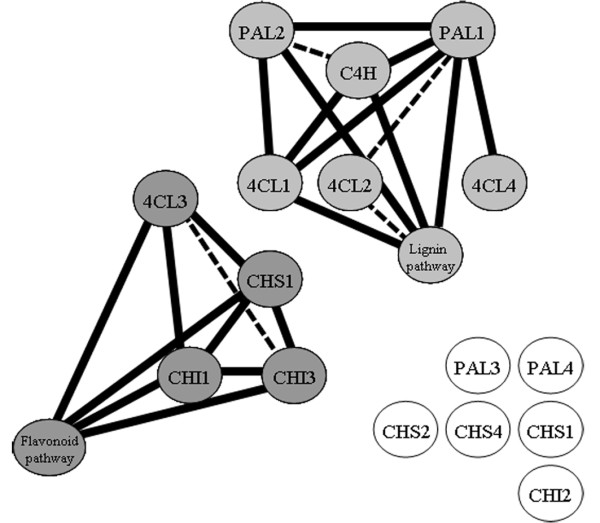
Co-expression analysis of candidate genes for flavonoid biosynthesis in A. thaliana. Correlations between the expression of a set of target genes (see Table 1) were established by bioinformatic analysis of 392 A. thaliana transcriptome datasets [34]. Circles represent genes as described in Table 1. Light grey circles represent genes where the expression correlates with that of genes involved in lignin metabolism (represented by C3H, HCT, CCoOMT), dark grey circles represent genes with expression correlating with genes of the flavonoid pathway (represented by FLS, F3H and several UGTs). White circles represent genes with expression profiles which do not correlate with genes involved in either the lignin or the flavonoid pathway. Solid lines represent Pearson correlations of expression above 0.7, dotted lines represent Pearson correlations between 0.6 and 0.7.