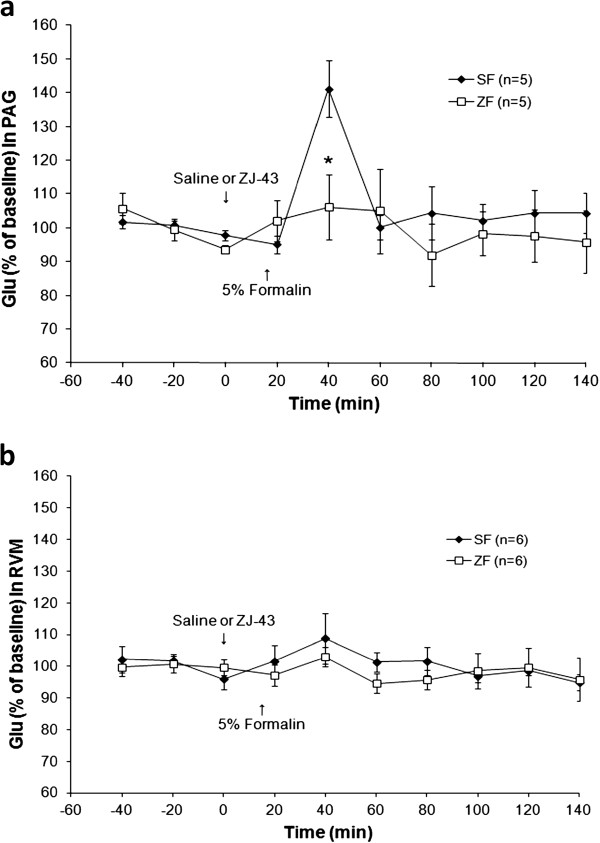
Figure 10.
Microdialysis sampling for glutamate release in the PAG and RVM following inflammation as in Figure9. Glutamate levels are expressed as a percent of the three baseline samples for each animal. Saline (S-F) or ZJ43 (Z-F, 150 mg/kg, i.p.) was injected at 0 time, formalin at the 15 minute time point. a. Microdialysis in the PAG. Inflammation significantly increased (p < 0.05) glutamate levels between the 20- and 40-minute time points (5–25 minutes after formalin injection) in the PAG relative to baseline samples. ZJ43 blocked inflammation-induced glutamate levels relative to saline treatment at over this interval (p < 0.05). b. Microdialysis in the RVM. Formalin-induced changes in extracellular glutamate levels above baseline were not detected using the standard 2 mm dialysis tip following saline–formalin (S-F) or ZJ43-formalin Z-F) treatments using the standard 2 mm dialysis tip nor with a 1 mm dialysis tip (S-F-1 mm). *p < 0.05. The same microdialysates samples from the PAG and RVM were analyzed for both NAAG (Figure 10) and glutamate (Figure 9).

