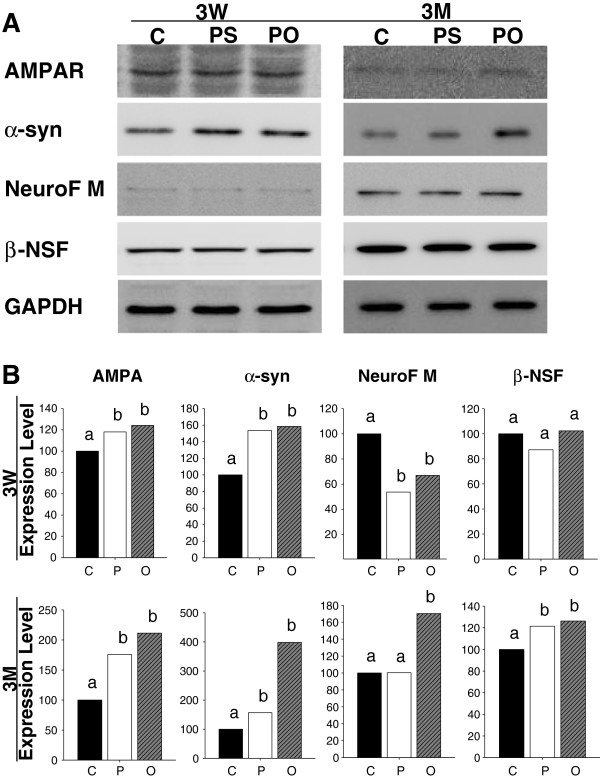
Figure 3.
Western blotting analysis on the hippocampus of rats fed perilla diets for 3 weeks (3W) and 3 months (3M).A. The bands of hippocampal proteins separated on SDS-PAGE and transferred to PVDF membrane were incubated with antibodies against AMPA receptor (AMPAR), α-synuclein (α-syn), neurofilament M (NeuroF M), and β-soluble NSF attachment protein (β-NSF) and decorated with a chemiluminescence. B. The intensities of the bands were captured with a densitometer and normalized according to that of GAPDH. The normalized band intensities were compared between control (C) and perilla (P) or perilla oil (O) diet groups, and presented as relative expressions (%) with the control group as 100%. Letters a and b on the bar graphs designate differences between the expression levels in each group with different letters for significant differences (p <0.05).

