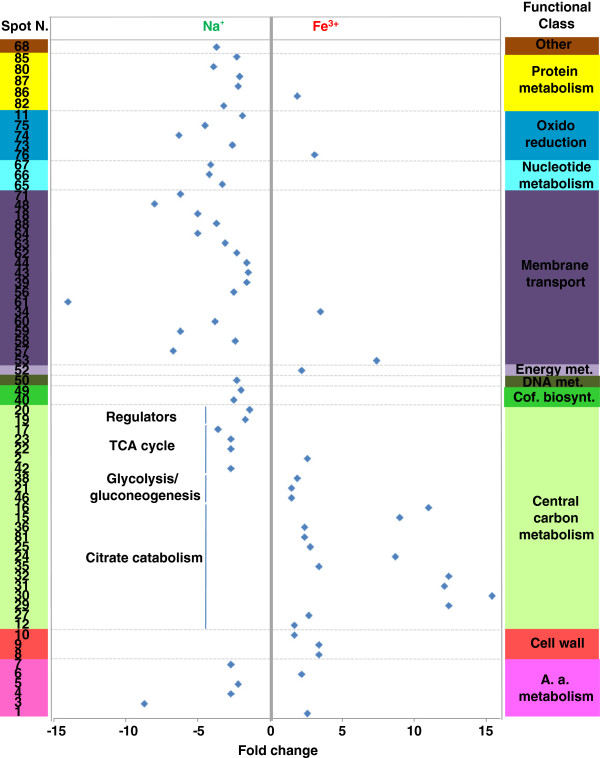
Figure 3.
Functional distribution and abundance fold change (blue diamond) of differentially represented protein spots resulting from the proteomic comparison between anaerobic growth on FEC and NAC. Fold change and spot number refer to Table 1. A. a. stands for Amino acid. Met. stands for metabolism. Cof. biosynth. stands for Cofactor biosynthesis.

