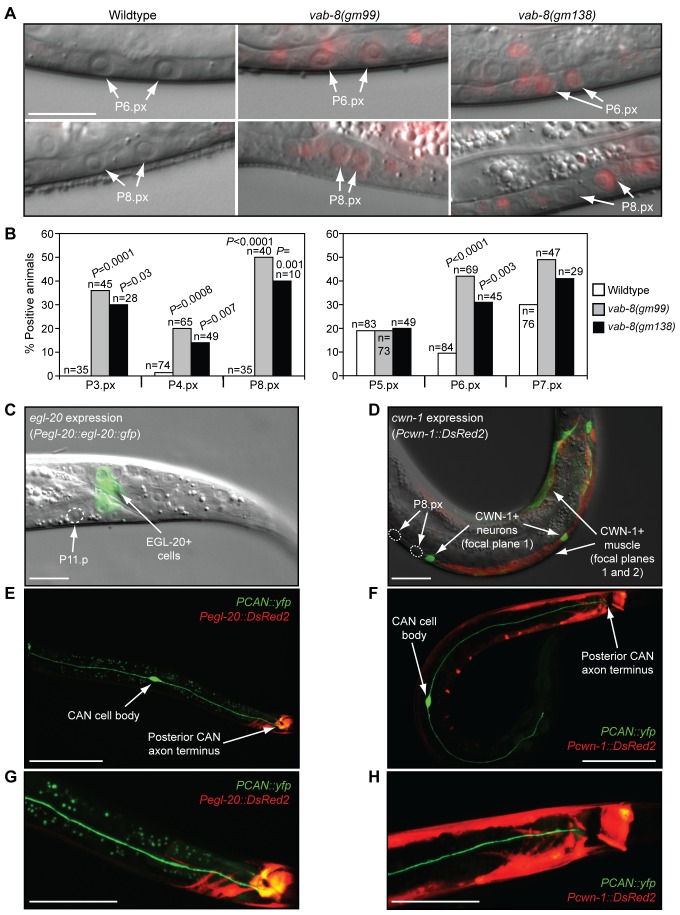
Figure 4. CAN neurons inhibit Wnt signaling in epidermal progenitors.
(A) Pn.px stage animals showing syIs187 mCherry Wnt reporter activity. Scale bar is 20 µm. (B) Quantification of reporter data. Reporter activity was lower in P5.px–P7.px cells than in P3.px, P4.px, and P8.px cells, so data were collected using a higher brightness setting. p-Values were calculated using a two-tailed Fisher's exact test versus wild-type animals. (C and D) Location of egl-20/wnt- and cwn-1/wnt-expressing cells relative to epidermal cells in L3, Pn.px stage animals. Scale bar is 10 µm. (C) muIs49[Pegl-20::egl-20::gfp] transgenic animal. (D) dyEx10[Pcwn-1::DsRed2] transgenic animal. To simultaneously visualize neurons and muscle, images were taken in different focal planes, differentially colored either green or red, and merged. (E–H) Location of Wnt-producing cells relative to CAN neurons. Only one CAN cell body is visible. (G and H) Blow-up of (E) and (F), respectively. Scale bars are 50 µm (E and F) and 25 µm (G and H). Transgenic arrays were akEx906 (E and G) and akEx908 (F and H).

