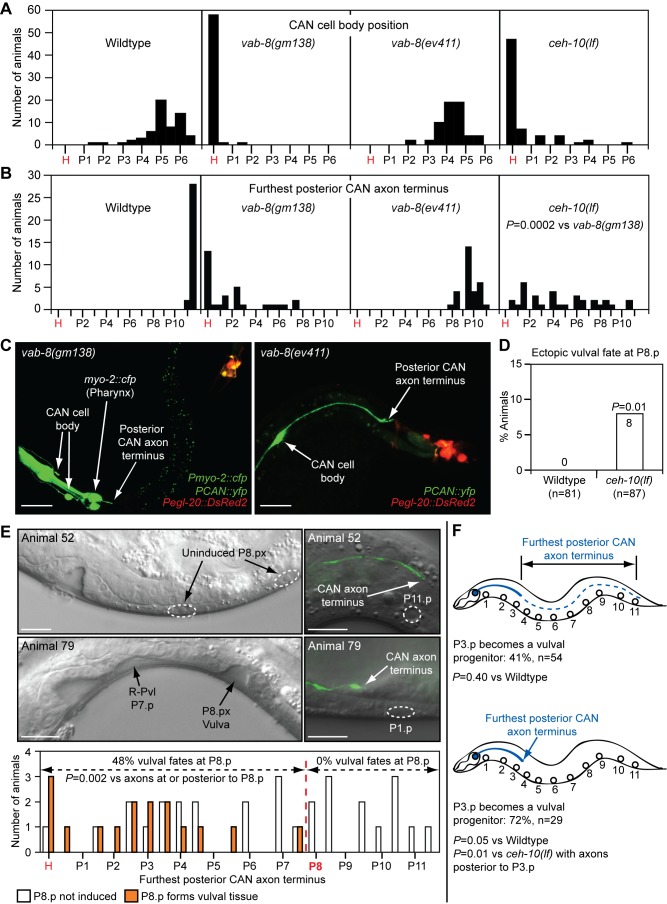
Figure 5. Posterior CAN axons regulate axial positioning of vulval fates and P3.p vulval progenitor frequency.
Distributions of positions of CAN cell bodies (A) and furthest posterior CAN axon termini (B) in different mutants. CAN neurons were visualized in L3, Pn.px stage (A and B) or L4 stage (E) animals with the kyIs4[Pceh-23::gfp] transgene. x-Axis indicates Pn.p or Pn.px positions. p-Value was calculated using a two-tailed Mann-Whitney U test. (C) Position of CAN cell bodies and posterior axon termini relative to egl-20/wnt-expressing cells in L2 stage vab-8 mutants. CANs and egl-20/wnt-expressing cells were marked with the akEx906 transgenic array. The bright green signal in the head/pharynx is from the coinjected Pmyo-2::cfp injection marker. Scale bar is 25 µm. (D) Frequency with which P8.p adopts a vulval fate in the total ceh-10 mutant population. (E) Correlation between the position of the furthest posterior CAN axon terminus and induction of ectopic vulval fates at P8.p in ceh-10(lf) mutants. For this study, an emphasis was placed on picking smaller animals to ensure that sufficient numbers of animals with short posterior CAN axons were obtained for statistical analysis. Thus, the combined frequency of ectopic vulval fates in this study is not an estimate of the actual frequency in the total population as conducted in (D). Top panels show animal 52, with normal epidermal development and normal position of furthest posterior CAN axon terminus. Bottom panels show animal 79, with an R-Pvl phenotype at P7.p and ectopic vulval fate at P8.p, and severely foreshortened furthest posterior CAN axon terminus. Scale bars are 10 µm. (F) Correlation between position of furthest posterior CAN axon terminus and frequency with which P3.p becomes a vulval progenitor in ceh-10(lf) mutants. In (D–F), p-Values were calculated using a two-tailed Fisher's exact test versus wild-type animals (D) or as otherwise indicated (E and F). H, head/pharyngeal region.

