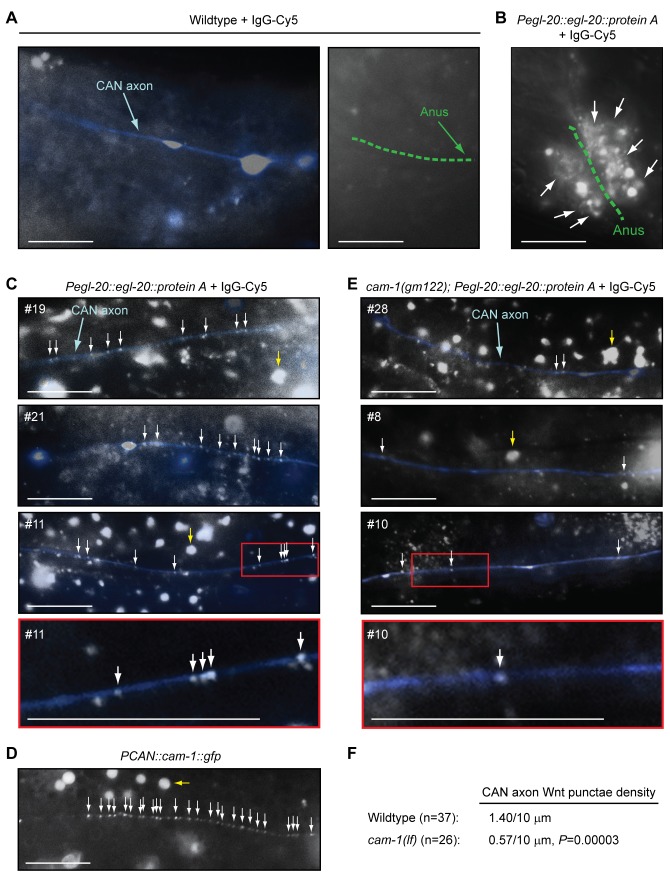
Figure 8. EGL-20/Wnt co-localizes with posterior CAN axons in vivo, in a Ror/CAM-1-dependent manner.
CAN axons were visualized with the integrated Pceh-23::gfp transgene (kyIs4) (A–C and E), and EGL-20/Wnt was detected with the integrated Pegl-20::egl-20::protein A fusion transgene (huIs60) and injection of Cy5-conjugated rabbit IgG (IgG-Cy5) into living adult animals (B, C, and E). (A–C and E) The Cy5 channel is shown, as well as an overlay of the GFP channel, where the posterior CAN axon has been pseudo-colored blue. White arrows point to examples of EGL-20/Wnt punctae, and yellow arrows point to examples of variable background autofluorescence. In (C) and (E), numbers in the panels denote particular injected animals. Bottom panels are enlargements of red-boxed sections in the indicated animals. (D) Clustering of Ror/CAM-1 in the posterior CAN axon. Ror/CAM-1 was visualized as a functional translational GFP fusion from an extrachromosomal transgenic array (PCAN::cam-1::gfp; dyEx44) in animals that also carried an egf/lin-3(lf) mutation. Scale bars are 10 µm. (F) 37 independent measurements from 32 wild-type animals, and 26 independent measurements from 19 ror/cam-1 mutants were used to calculate the mean EGL-20/Wnt density along the posterior CAN axon. p-Value was calculated using a two-tailed Mann-Whitney U test versus wild-type animals.

