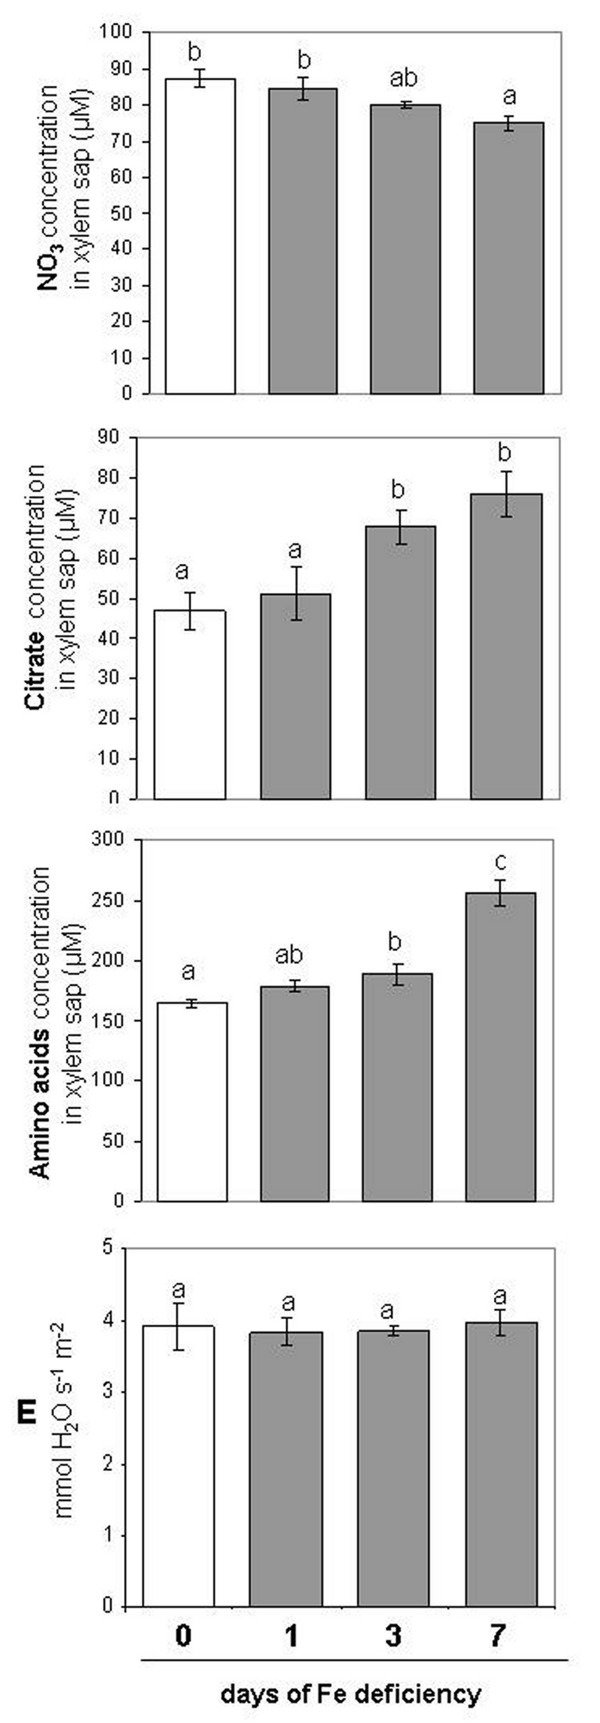
Figure 6.
Nitrate, citrate and total aa concentration in the xylem sap and plant transpiration rate (E). Xylem sap was collected from plant during the progression of Fe deficiency treatment. Sampling was performed at 0, 1, 3, 7 days after Fe withdraw. The concentration is expressed as μM. Data are means ± SE (n = 3). In the case of significant difference (P<0.05) values with different letters are statistically different.

