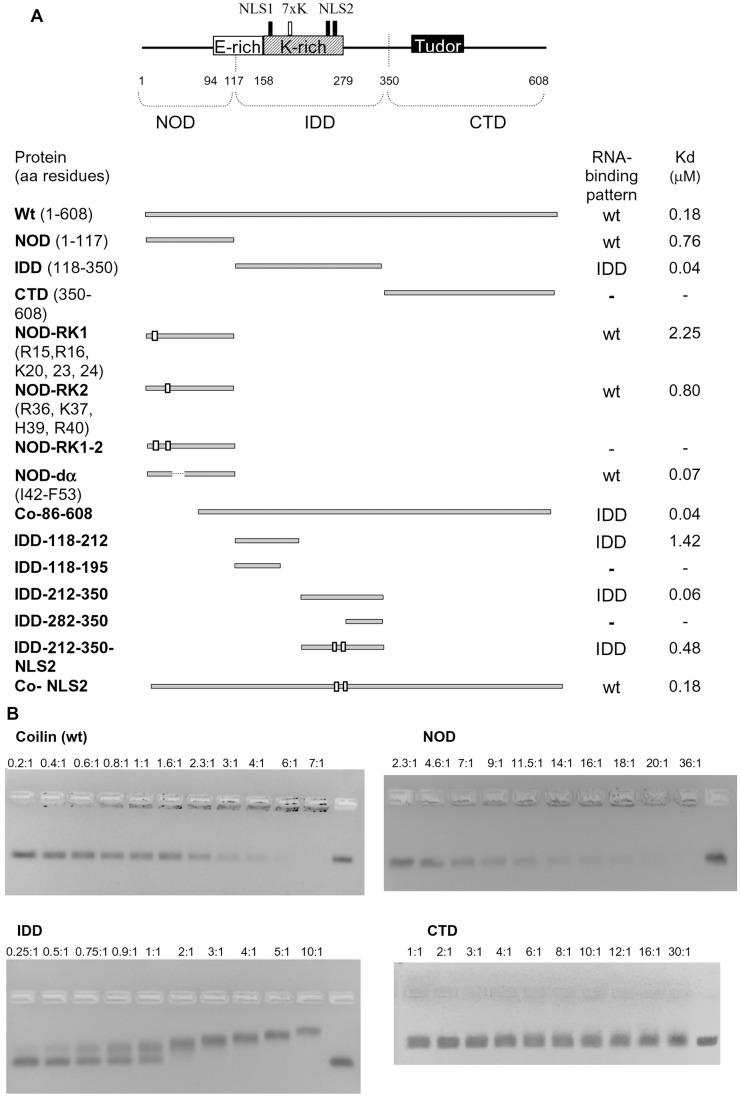
Figure 3. Atcoilin mutants and their RNA binding capacities.
(A) Schematic representation of Atcoilin and its mutants. The indicated protein regions and motifs are according to MyHits Motif Search, and the domain predictions are according to FoldIndex and DisoPred. The substitution mutations (R and K to A) are indicated by white boxes and the RNA-binding pattern and apparent Kd value for each mutant is indicated. (B) RNA binding capacity of Atcoilin and its isolated domains, as determined using EMSA. Increasing amounts of protein (protein:RNA ratios indicated above each lane) were incubated with 0.1 µg of RNA in RNA binding buffer (see Materials and Methods) and loaded onto 2% non-denaturing Tris-acetate agarose gels. The rightmost lane contains RNA without protein.

