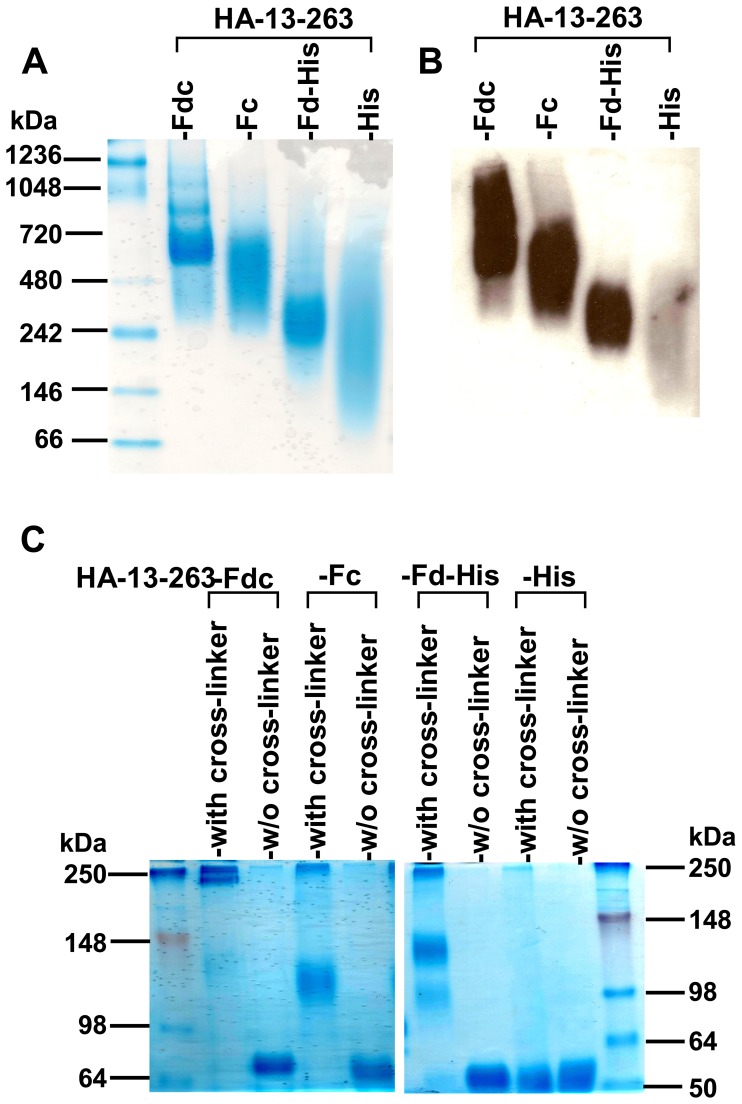
Figure 5. Detection of conformation of HA-13–263 proteins by native PAGE (N-PAGE) and cross-linker analysis.
(A) N-PAGE analysis of expressed HA-13–263 proteins, followed by Coomassie Blue staining and Western blot (B), by using a HA1-specific mAb. The native protein molecular weight marker (kDa) (Invitrogen) is indicated on the left. (C) Cross-linker analysis followed by SDS-PAGE and Coomassie Blue staining of expressed HA-13–263 proteins (with cross-linker). The proteins without cross-linking (w/o cross-linker) were used as the controls. The protein molecular weight marker (kDa) (Invitrogen) is indicated on the left.

