Figure 1.
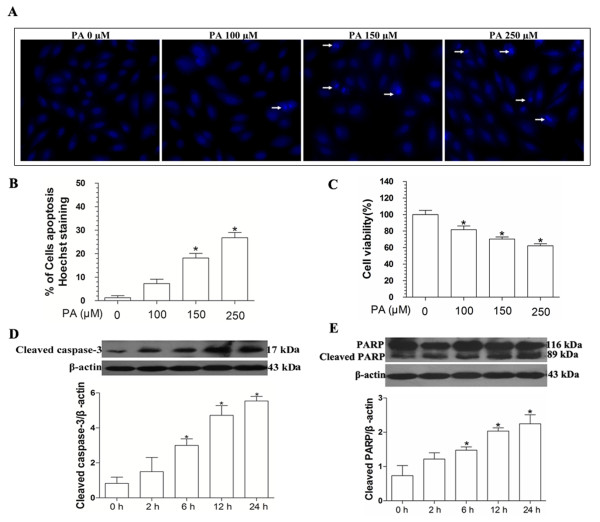
Palmitate-induced H9c2 cells apoptosis. Cells were treated with different concentrations of palmitate (0 μM, 100 μM, 150 μM and 250 μM) for 12 h, cell apoptosis was determined by Hoechst 33342 staining (A and B), and cell viability was measured using MTT assay (C). Cells were treated with 150 μM palmitate on time-dependent. Levels of cleaved caspase-3 (D) and PARP (E) were measured by immunoblot and quantitative analysis. These results were reported as mean ± S.E.M. * P< 0.05 versus control.

