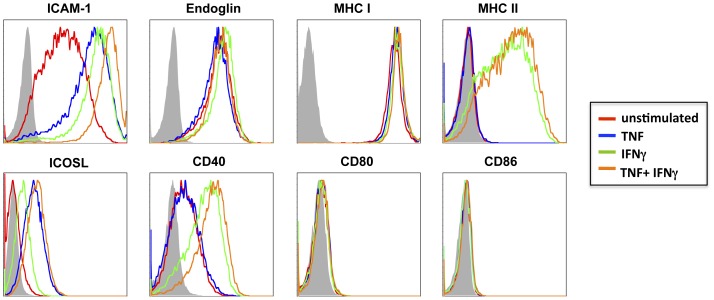
Figure 1. Expression of markers relevant to antigen presentation and T cell activation on HBEC.
Histograms represent flow cytometry results from unstimulated and cytokine stimulated HBEC cells 18 h following stimulation. HBEC were stimulated with either 10 ng/ml TNF (blue line), 50 ng/ml IFNg (green line), or 10 ng/ml TNF+50 ng/ml IFNg (orange line) and compared to unstimulated cells (red line). Cells were stained with mAbs against CD54 (ICAM-1), Endoglin (CD105), MHC II (HLA-DR), ICOSL (CD275), CD40, CD80 and CD86 as per manufacturers instructions. Data are representative of four independent experiments.

