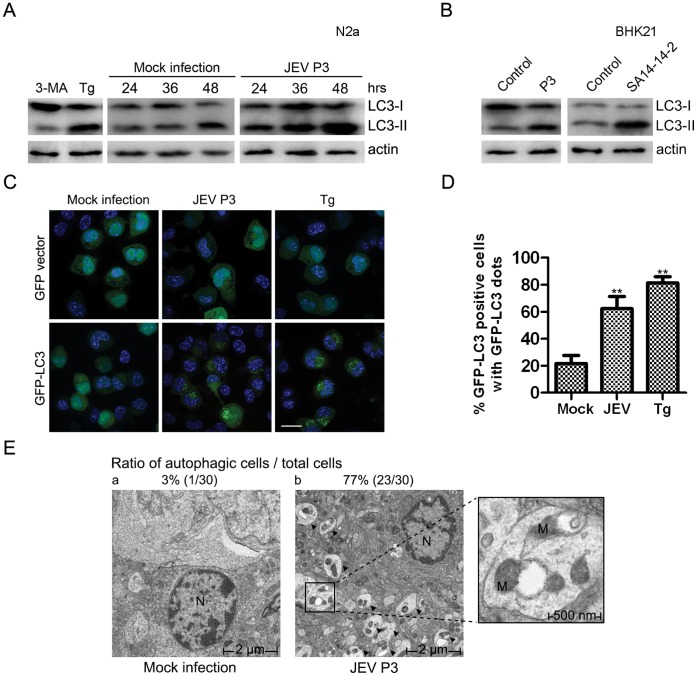
Figure 1. Induction of autophagy by JEV.
(A) N2a cells were treated with Tg (1 ug/ml, 24 hours) or 3-MA (10 mM, 24 hours) or infected or mock-infected with P3 virus (MOI = 1) for 48 hours. Cell lysates from different time points were harvested for immunoblotting. (B) BHK21 cells were infected or mock-infected with JEV P3 or SA14-14-2 virus for 48 hours, and the cell lysates were harvested for immunoblotting. (C) Twelve hours after transfection with GFP-LC3 or the GFP vector plasmid, N2A cells were mock-infected or infected with JEV P3 (MOI = 1) virus for 48 hours or treated with Tg for 24 hours. The nuclei were stained with DAPI, and the cells were observed under a fluorescence microscope. The white scale bar is 20 µm. (D) Cells were treated as in (C); cells containing five or more GFP-LC3 dots were defined as autophagy-positive cells. The percentages of cells with characteristic punctate GFP-LC3 fluorescence relative to all GFP-positive cells were calculated. The results represent the mean data from three independent experiments. The statistical significance of changes in viral RNA and virus yield compared with the control were calculated by t-test. **: P<0.01. (E) The ratio of autophagy (autophagic cells/total cells) was determined by counting the number of cells containing autophagic vacuoles among a total of 30 randomly selected cells. The larger boxed images on the right represent enlargements of the smaller boxed insets of (b). The arrows indicate representative autophagosome-like structures. The cell nucleus and mitochondria are abbreviated as N and M. a) mock-infected and b) JEV-infected mouse brains. The magnification is 2500 X.

