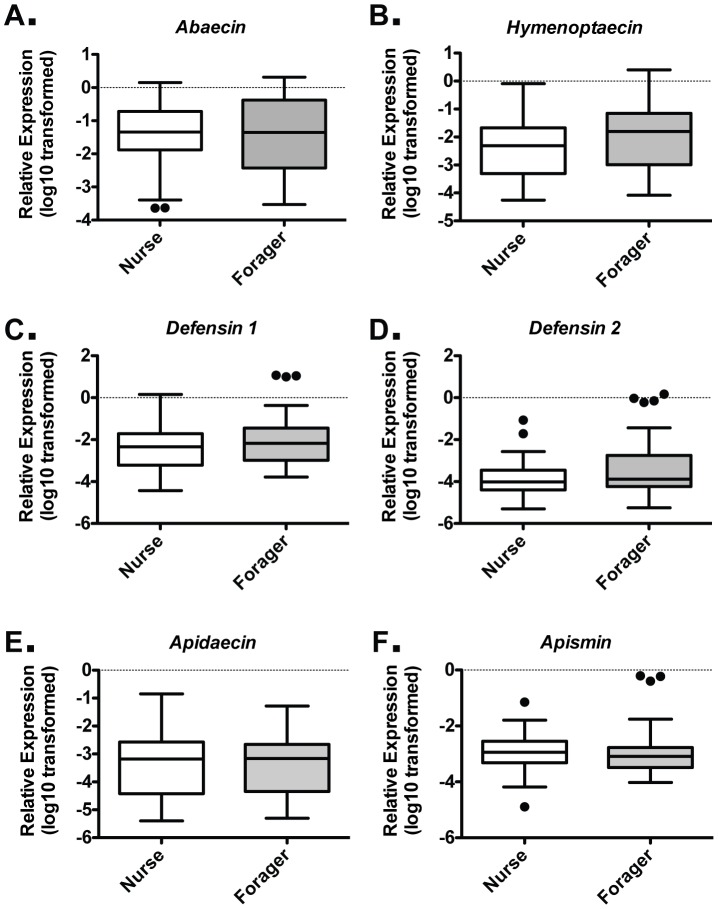
Figure 2. Similar midgut barrier AMP expression in nurse and forager stages.
Individual levels of the six honey bee AMPs relative to β-actin in midgut tissue for Nurses (n = 46) and Foragers (n = 45), as assessed by behavior and location cues, for Abaecin (A), Hymenoptaecin (B), Defensin 1 (C), Defensin 2 (D), Apidaecin (E), and Apisimin (F) from the six trials. Boxes show 1st and 3rd interquartile range with line denoting medians. Whiskers encompass 95% of the individuals. Outliers are denoted with filled circles.

