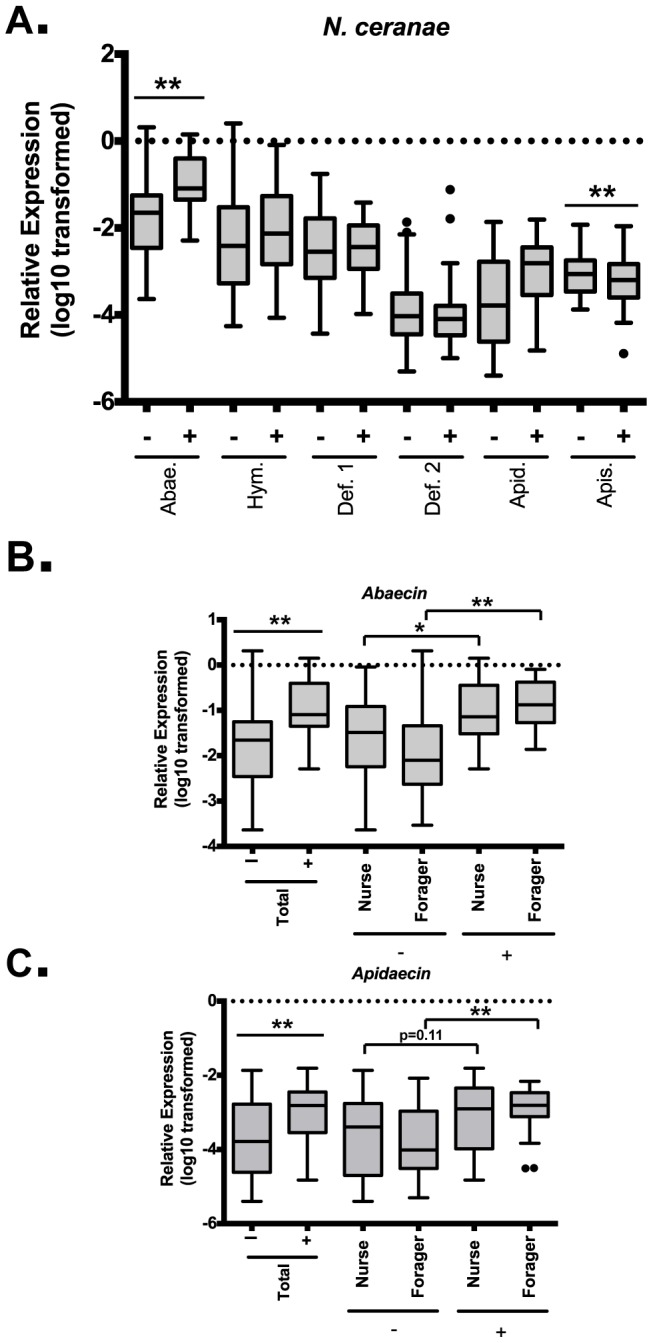
Figure 5. Differences in AMP expression between Nosema infected and non-infected bees are similar in nurse and foragers.

Levels of the six honey bee AMPs (Abaecin (n = 91), Hymenoptaecin (n = 91), Defensin 1 (n = 92), Defensin 2 (n = 91), Apidaecin (n = 92), and Apisimin (n = 92) relative to β-actin in midgut tissue from bees that were positive (+) or negative (−) for Nosema ceranae (A). Levels of Abaecin (B) and Apidaecin (C) relative to β-actin in midgut tissue from bees that were positive (+) or negative (−) for Nosema ceranae for all bees and split into nurses and foragers. Boxes show 1st and 3rd interquartile range with line denoting medians. Whiskers encompass 95% of the individuals. Outliers are denoted with filled circles.
