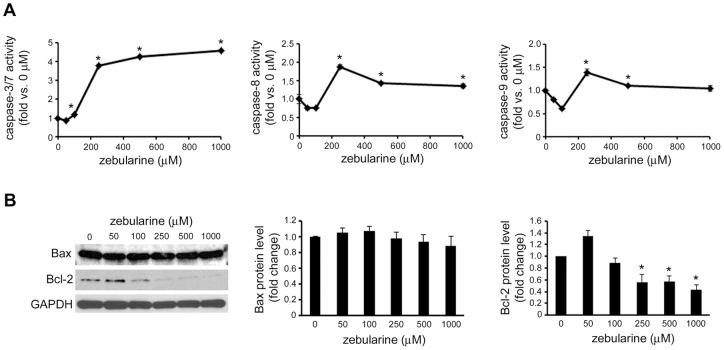
Figure 6. The effect of zebularine on apoptosis-related proteins.
HepG2 cells were treated with zebularine at indicated concentrations for 72 h. (A) Caspase-3/7, -8, and -9 activities were determined using Caspase-Glo Assays. The data are expressed as fold-increase relative to the respective untreated samples (RLU/60 min/μg protein). (B) The protein level of Bax and Bcl-2 after zebularine treatment for 72 h at different concentrations. After treatment, the cells were harvested and western blot analysis was performed to detect the protein level of Bax and Bcl-2. GAPDH was used as a loading control. Data are the means ± SEM of results from at least three independent experiments. *p<0.05, compared to 0 μM.

