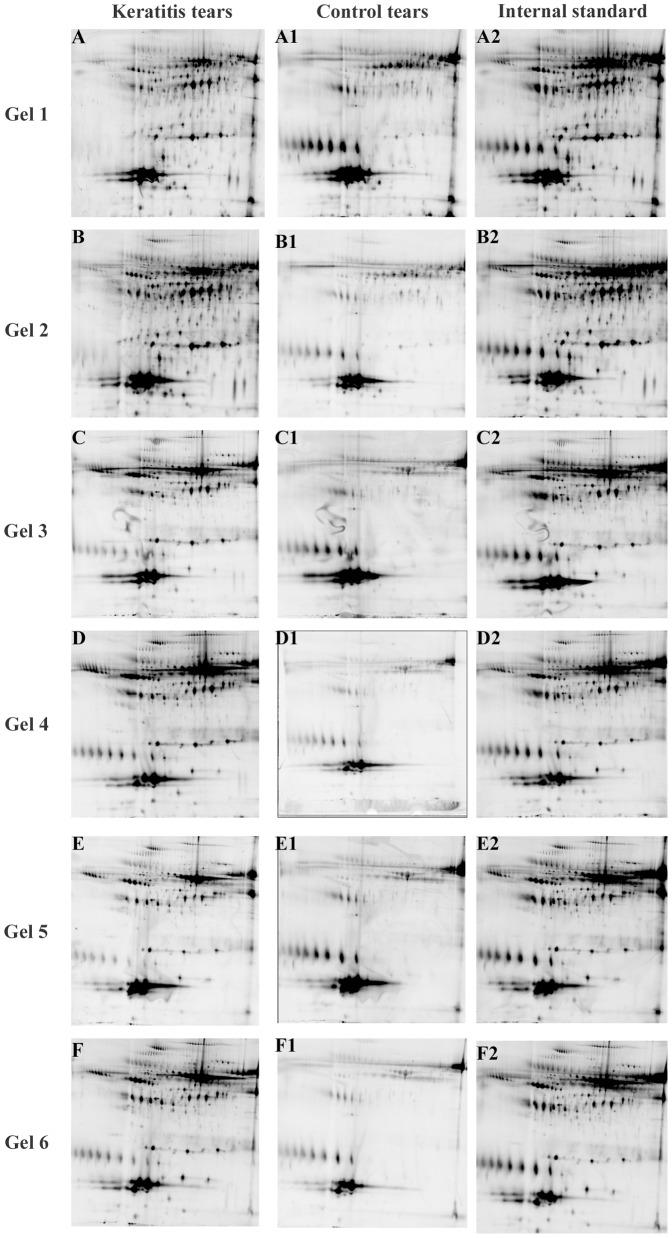
Figure 1. Fluorescent protein profiles of a set of six gels.
Experimental design is described in Table 1. A&B represents Fusarium early keratitis; C&D represents Fusarium intermediate keratitis; E&F represents Fusarium late keratitis; A1–F1 represents control tears; A2–F2 represents the pooled internal standard. Each gel contained 90 µg of total protein separated by a pH 4–7 IPG strip in the first dimension and 12.5% polyacrylamide gel in the second dimension electrophoresis. Images were captured using a Typhoon Trio Variable Mode Imager.

