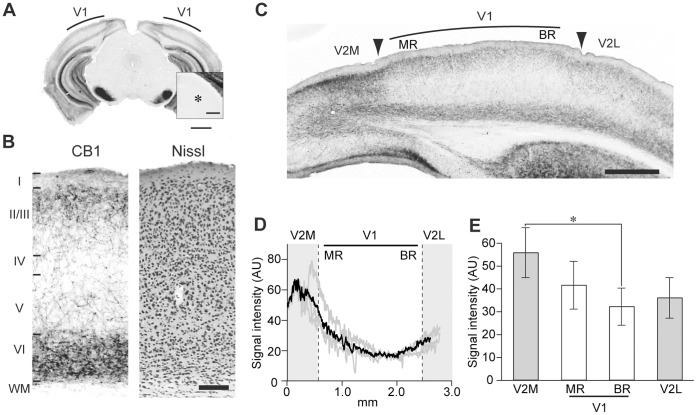
Figure 1. Distribution of CB1 in the visual cortex.
(A) Low-magnification image of a coronal section of mouse brain at P30, immunostained for CB1. Inset, magnified view of LGN (*). Scale, 1 mm and 250 µm (inset). (B) Layer distribution of CB1 immunoreactivity in V1 (CB1). Layer boundaries were determined in neighboring Nissl-stained sections (Nissl). Scale, 100 µm. (C) Regional distribution of CB1 immunoreactivity in the visual cortex. Arrowheads indicate the boundaries between V1 and V2, determined in Nissl-stained sections. V2M: secondary visual cortex medial area, V2L: secondary visual cortex lateral area, MR: monocular region, BR: binocular region. Scale, 500 µm. (D) Horizontal profiles of CB1 immunoreactivity across the visual cortex. Signal intensity was measured in layer II/III. Dotted lines indicate region boundaries. The gray lines represent the profiles in individual sections obtained from an animal, and the black line represents the mean of them. AU indicates arbitrary units. (E) Mean signal intensity of CB1 in each visual cortical region. The error bars indicate SEM (n = 5 animals, one-way repeated measured ANOVA, p<0.05, post hoc Tukey’s test, *: p<0.05).

