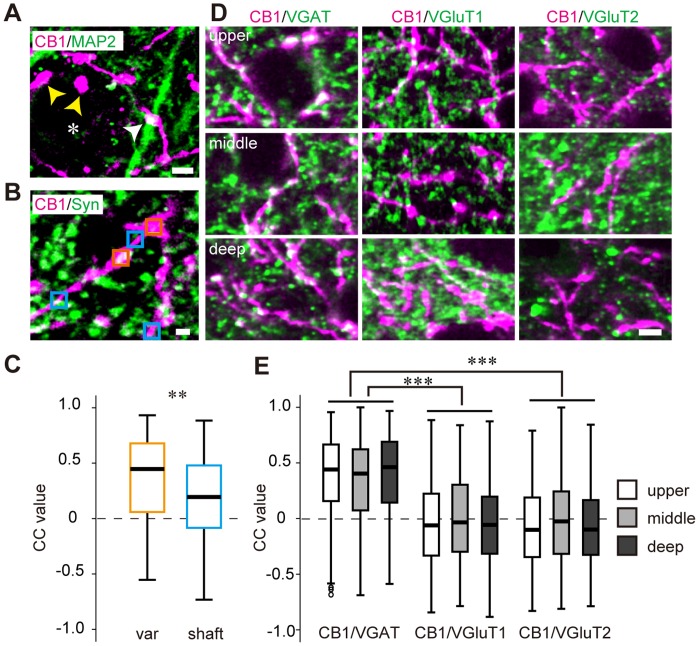
Figure 2. Synaptic localization of CB1 in V1.
(A) Double immunofluorescent staining of CB1 (magenta) and MAP2 (green) in the upper layer of V1. CB1-positive varicosities presumably contact MAP2-positive dendrites (white arrowheads) and soma (asterisk, yellow arrowheads). Scale, 3 µm. (B) Double immunofluorescent staining of CB1 (magenta) and synaptophysin (green) in the upper layer of V1. Rectangles indicate the ROIs for the correlation coefficient (CC) analysis set on varicosities (orange) and shafts (blue) of CB1-positive structures. Scale, 1 µm. (C) Box and whisker plots showing the CC values of CB1 and synaptophysin in varicosities (var, n = 154 ROIs) and shafts (shaft, n = 140 ROIs). The horizontal lines show the 25th, 50th, and 75th percentiles, and the whiskers show the max and minimum values. Mann-Whitney U test, **: p<0.01. (D) Double immunofluorescent staining of CB1 (magenta) and VGAT, VGluT1, VGluT2 (green). Representative photographs of the upper layer (top row), middle layer (middle row), and deep layer (bottom row) of V1. Scale, 3 µm. (E) Box and whisker plots showing the CC values of CB1 and VGAT, VGluT1, or VGluT2 in each layer of V1 (n = 6 animals each; in the upper layer, n = 1226 ROIs (CB1/VGAT), 1203 ROIs (CB1/VGluT1), 1212 ROIs (CB1/VGluT2); in the middle layer, n = 492 ROIs (CB1/VGAT), 435 ROIs (CB1/VGluT1), 498 ROIs (CB1/VGluT2); in the deep layer, n = 1556 ROIs (CB1/VGAT), 1712 ROIs (CB1/VGluT1), 1492 ROIs (CB1/VGluT2)). The small circles indicate the outliers of the distribution of the CC values. In the box and whisker plots containing the outliers, the bottom of the whisker shows the value of the 25th percentile-1.5IQR. Statistical comparison among layers was performed by Bonferroni-corrected Mann-Whitney U test (***: p<0.00033).

