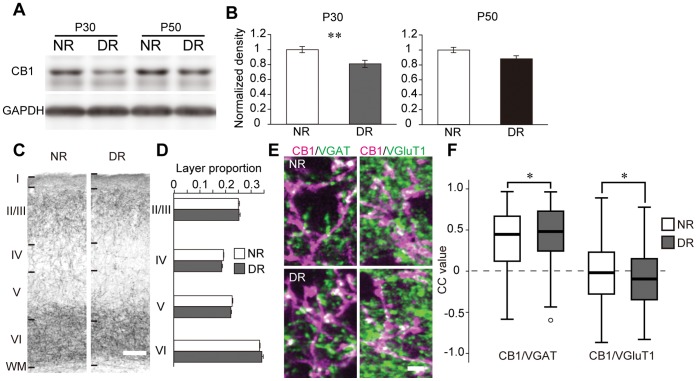
Figure 4. Effects of dark rearing on CB1 expression.
(A) Representative western blots of CB1 and GAPDH in V1. The blots of normal light/dark condition-reared (NR) and dark-reared (DR) mice at P30 and P50 are shown. (B) Mean and SEM of the blot density of CB1 (P30: n = 16 (NR) and 21 (DR) animals, P50: n = 5 (NR) and 5 (DR) animals; unpaired t-test, **: p<0.01). (C) Layer distribution of CB1 immunoreactivity in V1. Photographs represent immunostained sections of NR and DR animals at P30. Layer boundaries were determined in neighboring Nissl-stained sections. Scale, 100 µm. (D) CB1 immunoreactivity in individual layers of NR and DR animals at P30. Intensities in each layer are represented as the proportion to the all-layer intensities (two-way ANOVA, p>0.05). (E) Double immunofluorescent staining of CB1 (magenta) and VGAT, VGluT1 in the deep layer of V1 of NR (upper) and DR (lower) animals at P30. Scale, 3 µm. (F) Box and whisker plots showing the CC values of CB1 and VGAT, VGluT1 in the deep layer of NR and DR animals at P30 (n = 3 animals each; NR animals: n = 531 ROIs (CB1/VGAT), 244 ROIs (CB1/VGluT1), DR animals: n = 594 ROIs (CB1/VGAT), 343 ROIs (CB1/VGluT1), Mann-Whitney U test, *: p<0.05).

