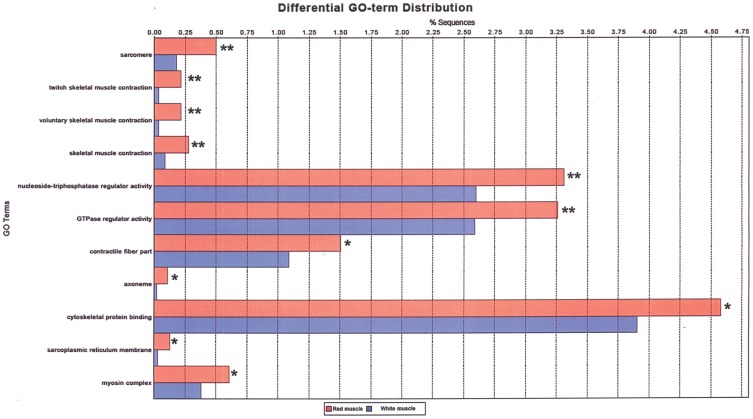
Figure 2. Differential GO term distribution between red and white muscle.
The red muscle transcriptome (red bars) was tested against the white muscle transcriptome (blue bars). Significant differences by a corrected p-value for multiple testing False Discovery Rate (FDR) are indicated by ** FDR≤0.01 and * FDR≤0.05. Significant differential expression was found for biological processes including twitch skeletal muscle contraction, voluntary skeletal muscle contraction and skeletal muscle contraction; for molecular functions including nucleoside-triphosphatase regulator activity, GTPase regulator activity and cytoskeletal protein binding; and cellular components including sarcomere, contractile fiber part, axoneme, sarcoplasmic reticulum membrane and myosin complex. In all cases, the percentage of sequences was higher in red than in white muscle.

