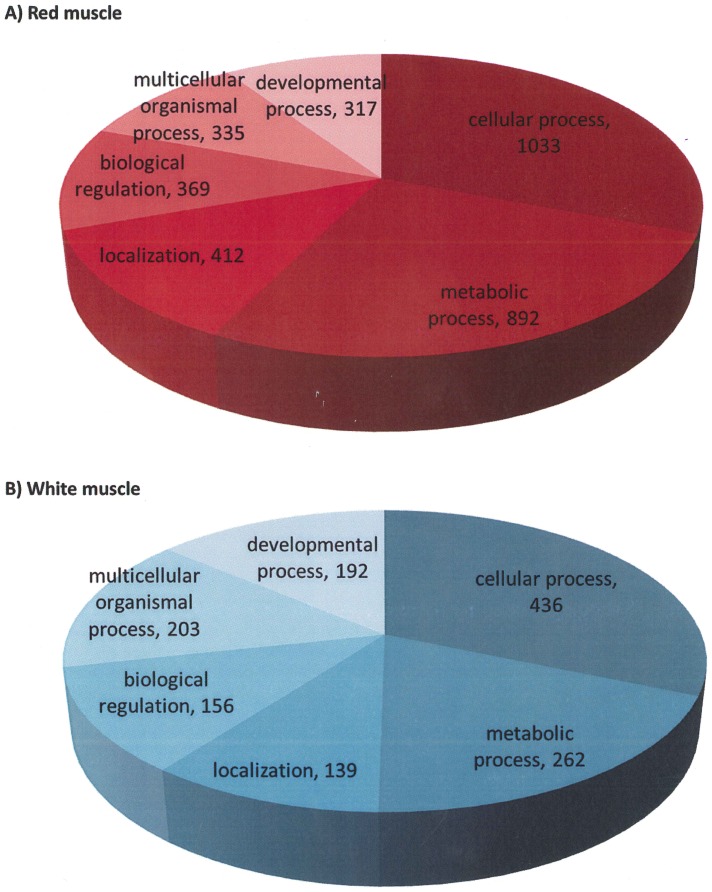
Figure 3. Gene ontology of the large contigs (≥500 nt) in red and white muscle.
Illustrated as pie charts are the six largest categories in red muscle (A) and white muscle (B) at biological process level 2 with the numbers of sequences per category indicated. Gene ontology processes are cellular process; metabolic process; localization; biological regulation; multicellular organismal process and developmental process in both red and white muscle without any relevant percentual differences between both tissues. Categories are however represented by a larger number of sequences in red muscle than in white muscle.

