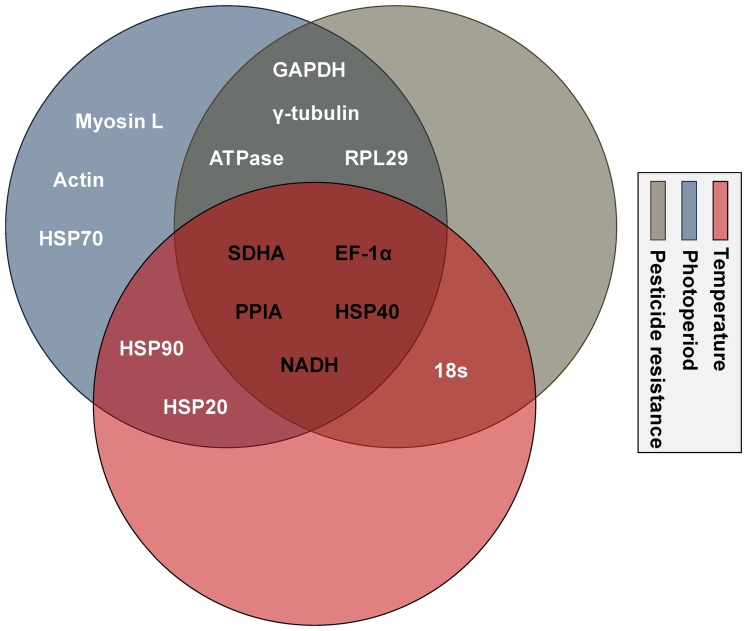
Figure 2. Reference genes selected by geNorm under various abiotic conditions.
The expression stability measure (M) is the mean of the stability values of the remaining genes. The least stable genes have the highest M values. The genes listed here are considered stable based on a cutoff M value of less than 0.5. Each circle with a distinct color represents a different set of biotic condition. Genes located within one circle are stable under a specific abiotic condition, and genes shared with multiple circles are stable across those conditions.

