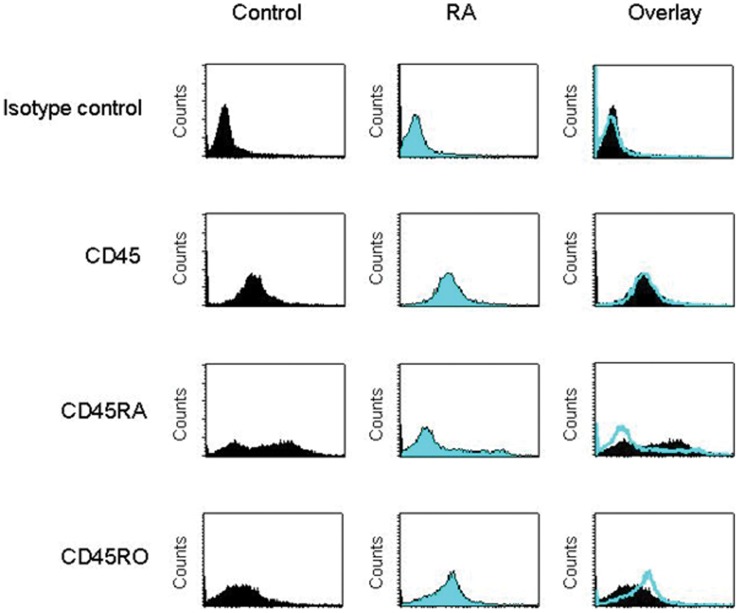
Figure 3. Expression of CD45 isoforms.
Purified CD3+ T cells (1×10⁶/ml), isolated from control and RA patients, were labelled with PE anti-CD45, anti-CD45RA or anti-CD45RO mAbs and analysed using FACScan flow cytometry. The MFI of labelled cells from one representative experiment out of seven with similar results, were reported (Control and RA n = 7). Background fluorescence values of cells were obtained using isotype control.

