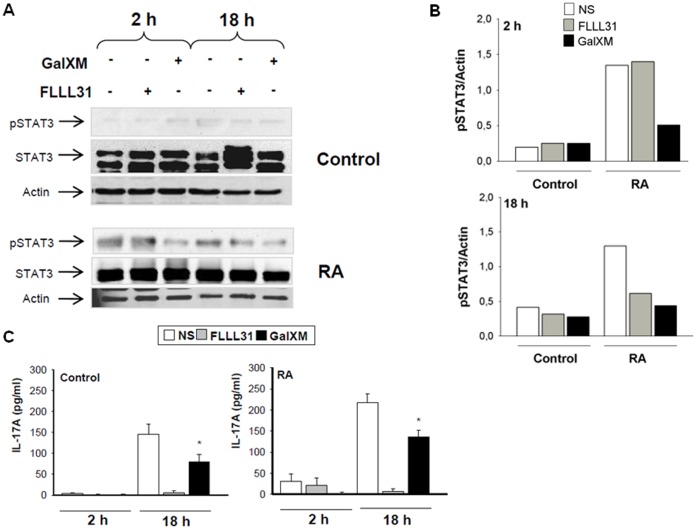
Figure 6. Phospho-STAT3 activation and IL-17A production.
PBL (5×10⁶/ml) were activated for 30 min with soluble anti-CD3 (3 µg/ml) and anti-CD28 (3 µg/ml) mAbs, washed, and subsequently incubated for 2 or 18 h in the presence or absence of GalXM (10 µg/ml) or FLLL31 (5 µmol/L). After incubation, cell lysates were analysed by Western blotting. Membranes were incubated with anti-pSTAT3 and anti-STAT3 Abs. Actin was used as an internal loading control (A). Normalization was shown in panel B. Culture supernatants were collected to test IL-17A levels by specific ELISA assay (C). *, p<0.05 (Control and RA, n = 7; GalXM treated vs untreated cells). The results reported in the bar graph of panel C are the mean ± SEM.

