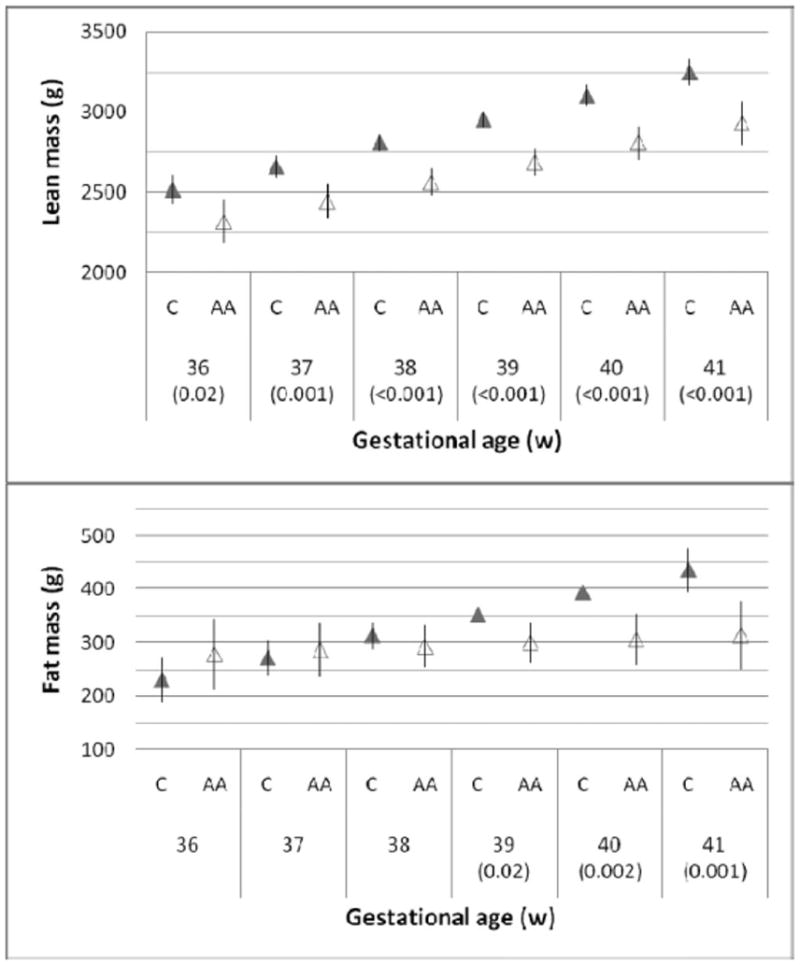
Figure 1. Ethnicity and late gestation body composition.

Lean and fat mass according to completed weeks of gestation at birth (mean and SEM). Figures in parentheses are P-values for group differences <0.05 among African Americans (open triangles) and Caucasians (shaded triangles) (neonatal sex, maternal age, prepregnancy weight, and pregnancy weight gain were covariates).
