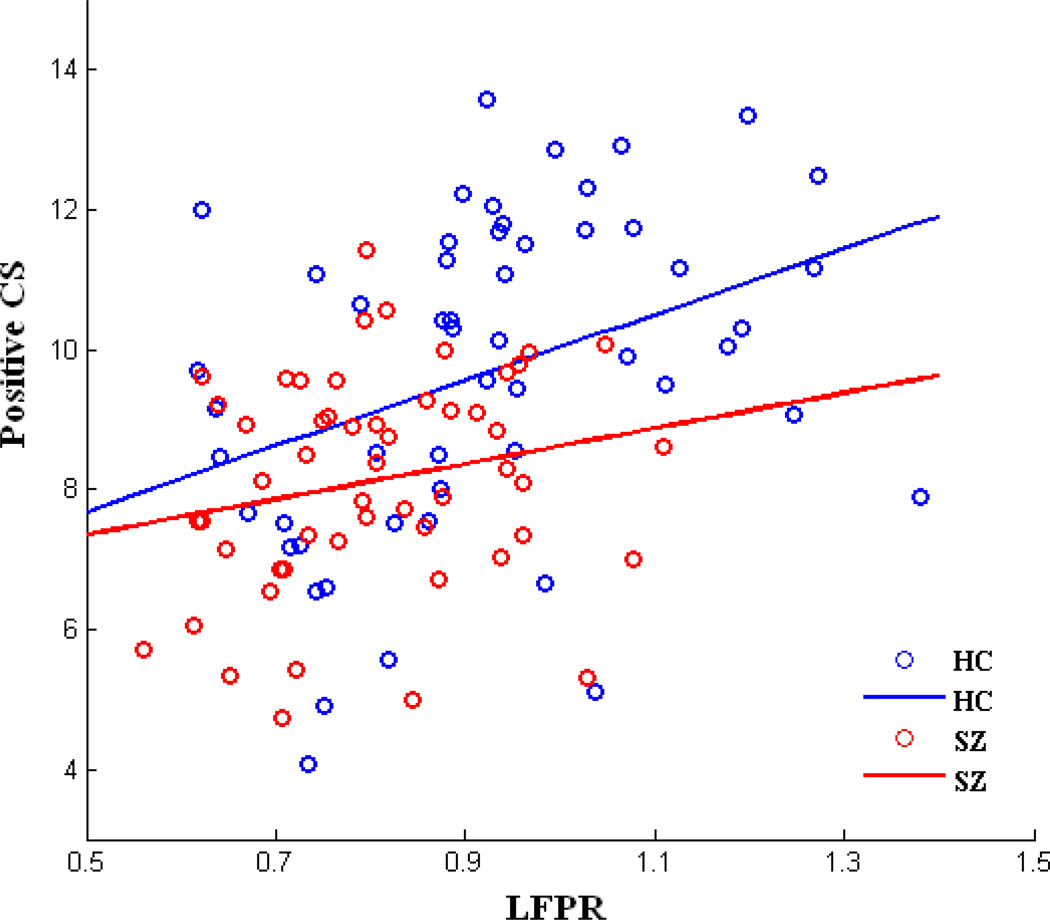
Figure 4.
Scatter plots with trend lines showing group mean positive connectivity strength (CS) as a function of group mean low frequency power ratio (LFPR) in HCs and SZs. Each dot denotes a brain component. Pearson correlation coefficient for HCs (r = 0.367, P = 0.007), for SZs (r = 0.213, P = 0.126).

