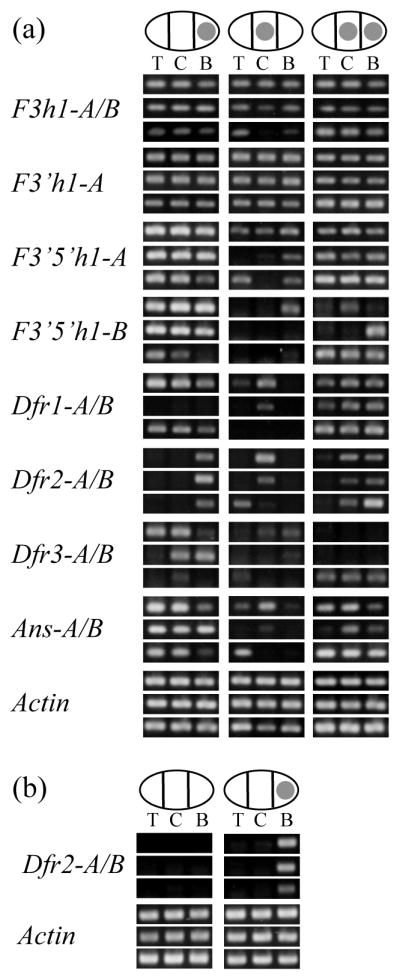
Fig. 4.

Spatial expression of anthocyanin biosynthetic genes in C. gracilis petals. (a) Expression patterns for three individual plants for each of the P-locus phenotypes. The same nine individuals were used for all genes, and they are placed in the same position for each panel. Ovals represent petals, and filled circles represent spot locations. T, C, and B refer to top, central, and basal sections of the petals. F3h, flavanone 3 hydroxylase; F3′h, flavanoid 3′ hydroxylase; F3′5′h, flavonoid 3′-5′ hydroxylase; Dfr, dihydroflavonol-4-reductase; Ans, anthocyanidin synthase; (b) Expression patterns for Dfr2 in three spotted and three unspotted plants from a F2 population segregating for I.
