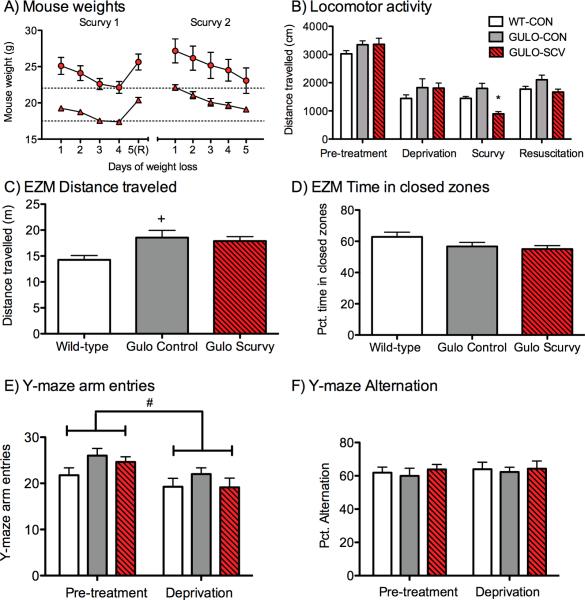
Figure 2. Weights, locomotor activity and control tasks.
(A) Mouse weights were recorded daily during the two Scurvy phases in male (circles) and female (triangles) mice. Weight loss was permitted to continue for up to 5 days before resuscitation (marked R on X-axis) or sacrifice. Mice were not permitted to drop below 20% of their pre-deprivation body weight (dashed lines). (B) Locomotor activity before, during and after the initial scurvy phase, GULO-SCV mice only differed from control groups during the Scurvy phase. (C) Elevated zero maze (during pre-treatment phase), distance traveled. WT-CON Mice explored the maze less than the other groups but there were no differences in time spent in open versus closed areas of the maze (D) Elevated zero maze, percent time in closed zone. Experimental groups did not differ on (E) Y-maze arm entries (during pre-treatment and first deprivation phase), or (F) Percent alternation during either test phase. *p<0.05 different from both control groups during the same testing phase, +p<0.05 different from WT-CON only #p<0.05 different from previous test phase (all groups).

